|
Download Data (XLS File) |
|
||||||||
|
||||||||
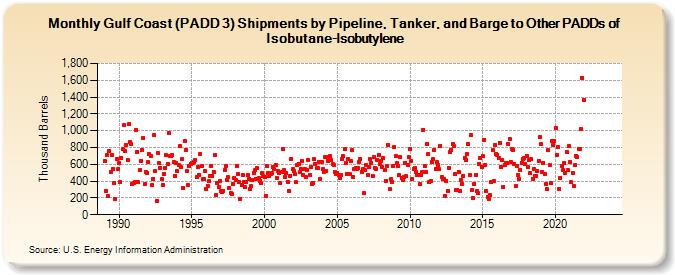
| Gulf Coast (PADD 3) Shipments by Pipeline, Tanker, and Barge to Other PADDs of Isobutane-Isobutylene (Thousand Barrels) | ||||||||
| Year | Jan | Feb | Mar | Apr | May | Jun | Jul | Aug | Sep | Oct | Nov | Dec |
|---|---|---|---|---|---|---|---|---|---|---|---|---|
| 1989 | 642 | 287 | 715 | 221 | 760 | 508 | 706 | 548 | 379 | 187 | 663 | 544 |
| 1990 | 612 | 389 | 676 | 777 | 1,064 | 754 | 828 | 657 | 1,079 | 864 | 839 | 367 |
| 1991 | 381 | 393 | 1,014 | 746 | 386 | 531 | 640 | 770 | 911 | 361 | 509 | 495 |
| 1992 | 623 | 717 | 701 | 350 | 429 | 953 | 515 | 160 | 734 | 613 | 553 | 422 |
| 1993 | 359 | 483 | 561 | 706 | 602 | 977 | 701 | 695 | 712 | 627 | 464 | 620 |
| 1994 | 519 | 595 | 814 | 562 | 662 | 318 | 872 | 771 | 516 | 350 | 579 | 609 |
| 1995 | 612 | 614 | 629 | 653 | 449 | 565 | 470 | 724 | 575 | 428 | 422 | 519 |
| 1996 | 310 | 342 | 396 | 455 | 577 | 462 | 512 | 709 | 230 | 374 | 326 | 401 |
| 1997 | 283 | 268 | 282 | 532 | 580 | 409 | 445 | 315 | 256 | 244 | 367 | 440 |
| 1998 | 412 | 580 | 484 | 394 | 192 | 348 | 472 | 394 | 326 | 391 | 477 | 426 |
| 1999 | 305 | 341 | 408 | 500 | 527 | 420 | 553 | 437 | 406 | 372 | 492 | 463 |
| 2000 | 454 | 226 | 580 | 495 | 463 | 489 | 495 | 572 | 544 | 593 | 437 | 525 |
| 2001 | 497 | 372 | 504 | 785 | 529 | 446 | 495 | 392 | 285 | 465 | 667 | 544 |
| 2002 | 523 | 482 | 385 | 593 | 608 | 503 | 549 | 645 | 473 | 544 | 446 | 529 |
| 2003 | 654 | 477 | 566 | 368 | 375 | 660 | 605 | 552 | 555 | 625 | 426 | 631 |
| 2004 | 542 | 508 | 691 | 520 | 640 | 690 | 698 | 652 | 603 | 593 | 511 | 489 |
| 2005 | 502 | 478 | 441 | 471 | 659 | 693 | 779 | 618 | 490 | 664 | 488 | 635 |
| 2006 | 766 | 450 | 549 | 560 | 541 | 552 | 633 | 667 | 510 | 539 | 254 | 528 |
| 2007 | 587 | 478 | 563 | 667 | 620 | 463 | 689 | 559 | 550 | 655 | 715 | 606 |
| 2008 | 641 | 570 | 675 | 528 | 407 | 574 | 833 | 303 | 420 | 388 | 581 | 807 |
| 2009 | 695 | 618 | 580 | 468 | 684 | 437 | 410 | 445 | 621 | 456 | 593 | 685 |
| 2010 | 786 | 644 | 431 | 544 | 560 | 513 | 472 | 473 | 366 | 471 | 512 | 1,014 |
| 2011 | 579 | 514 | 847 | 722 | 384 | 398 | 626 | 664 | 768 | 549 | 623 | 590 |
| 2012 | 541 | 821 | 446 | 429 | 425 | 222 | 399 | 285 | 561 | 743 | 770 | 845 |
| 2013 | 814 | 479 | 295 | 293 | 514 | 281 | 409 | 370 | 465 | 680 | 653 | 725 |
| 2014 | 841 | 472 | 944 | 294 | 198 | 369 | 478 | 282 | 255 | 606 | 673 | 571 |
| 2015 | 694 | 894 | 591 | 281 | 212 | 188 | 231 | 388 | 769 | 398 | 829 | 726 |
| 2016 | 712 | 674 | 859 | 573 | 649 | 333 | 590 | 616 | 611 | 838 | 905 | 626 |
| 2017 | 777 | 775 | 603 | 343 | 585 | 474 | 426 | 535 | 621 | 666 | 675 | 599 |
| 2018 | 700 | 565 | 655 | 497 | 660 | 427 | 543 | 459 | 462 | 515 | 640 | 920 |
| 2019 | 837 | 508 | 621 | 481 | 365 | 306 | 772 | 594 | 372 | 879 | 835 | 877 |
| 2020 | 1,030 | 710 | 806 | 308 | 442 | 584 | 536 | 620 | 500 | 744 | 527 | 817 |
| 2021 | 633 | 386 | 496 | 337 | 594 | 703 | 688 | 787 | 787 | 1,019 | 1,631 | 1,371 |
| 2022 | -- | -- | -- | -- | -- | -- | -- | -- | -- | -- | -- | -- |
| 2023 | -- | -- | -- | -- | -- | -- | -- | -- | -- | -- | -- | -- |
| 2024 | -- | |||||||||||
| - = No Data Reported; -- = Not Applicable; NA = Not Available; W = Withheld to avoid disclosure of individual company data. |
| Release Date: 3/29/2024 |
| Next Release Date: 4/30/2024 |