|
Download Data (XLS File) |
|
||||||||
|
||||||||
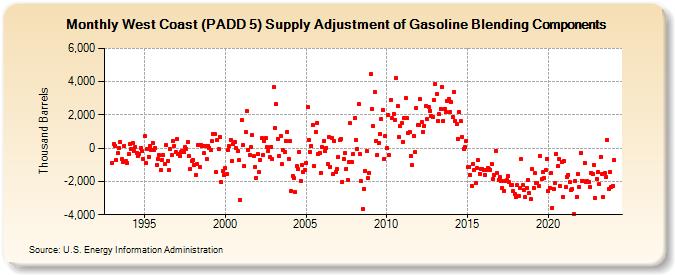
| West Coast (PADD 5) Supply Adjustment of Gasoline Blending Components (Thousand Barrels) | ||||||||
| Year | Jan | Feb | Mar | Apr | May | Jun | Jul | Aug | Sep | Oct | Nov | Dec |
|---|---|---|---|---|---|---|---|---|---|---|---|---|
| 1993 | -874 | 256 | 132 | -725 | -319 | 13 | 367 | -664 | -806 | 142 | -766 | -893 |
| 1994 | -360 | 281 | -46 | 324 | -170 | 62 | -318 | -442 | -331 | 33 | -186 | -667 |
| 1995 | 707 | -919 | -65 | -500 | 151 | -114 | 320 | -93 | 5 | -982 | -667 | -427 |
| 1996 | -1,323 | -700 | -435 | -972 | 200 | -763 | -1,327 | -54 | -426 | 433 | 144 | -229 |
| 1997 | 551 | -324 | -450 | -259 | -142 | -204 | 77 | -22 | 376 | -476 | -1,226 | -793 |
| 1998 | -681 | -1,002 | -1,606 | -942 | 197 | -1,139 | 194 | 155 | -314 | 159 | -639 | 160 |
| 1999 | 39 | -131 | 407 | 868 | 840 | -1,449 | 468 | -54 | 694 | -2,046 | -1,380 | -1,589 |
| 2000 | -1,206 | -1,536 | -135 | 128 | 505 | -775 | 240 | 380 | -1 | -166 | -696 | -3,086 |
| 2001 | 1,682 | 165 | -1,061 | 944 | 2,244 | -102 | -405 | 42 | 771 | -490 | -1,105 | -1,772 |
| 2002 | -347 | -1,450 | -707 | 584 | -411 | 445 | 626 | 70 | -149 | -554 | 88 | -669 |
| 2003 | 3,682 | 1,243 | 2,630 | 569 | -481 | 730 | -967 | -129 | -221 | 417 | 969 | -630 |
| 2004 | 404 | -2,576 | -1,678 | -1,819 | -2,627 | -1,095 | -1,261 | -229 | -1,966 | -1,024 | -1,408 | -1,286 |
| 2005 | -879 | 2,486 | 521 | -220 | 134 | 1,420 | -1,085 | 955 | 1,529 | -320 | -289 | -1,467 |
| 2006 | 60 | 448 | -194 | 18 | -962 | 657 | -1,116 | 600 | -1,577 | 406 | -1,426 | -1,246 |
| 2007 | -542 | 498 | 563 | -2,006 | -654 | -277 | -1,229 | -1,904 | -837 | 1,490 | -821 | -359 |
| 2008 | 1,785 | 471 | -32 | 2,640 | -375 | -1,994 | -3,671 | -2,425 | -1,372 | -193 | -1,809 | -1,506 |
| 2009 | 4,443 | 2,371 | 1,310 | 3,385 | 462 | -409 | 336 | 826 | 1,726 | 2,286 | -642 | 725 |
| 2010 | -10 | 1,986 | -430 | 2,921 | 1,788 | 2,061 | 1,684 | 4,216 | 2,555 | 684 | 1,331 | 1,485 |
| 2011 | 397 | 1,795 | 3,007 | 1,803 | 941 | 988 | -452 | -1,034 | 724 | -249 | 2,411 | 1,392 |
| 2012 | 1,382 | 2,955 | 1,546 | 985 | 1,348 | 2,529 | 1,747 | 2,498 | 2,256 | 1,926 | 1,851 | 2,875 |
| 2013 | 3,833 | 3,230 | 1,643 | 2,038 | 2,356 | 3,702 | 1,647 | 2,378 | 2,197 | 2,861 | 2,944 | 2,186 |
| 2014 | 2,770 | 1,863 | 3,382 | 1,620 | 1,460 | 576 | 2,158 | 1,607 | 682 | -26 | 59 | 432 |
| 2015 | -1,150 | -1,103 | -1,602 | -2,250 | -921 | -1,320 | -2,111 | -1,194 | -728 | -1,527 | -1,229 | -1,237 |
| 2016 | -1,285 | -1,603 | -1,321 | -1,191 | -1,264 | -1,294 | -935 | -1,882 | -1,610 | -142 | -1,500 | -1,886 |
| 2017 | -1,740 | -1,954 | -2,380 | -2,547 | -1,967 | -1,926 | -1,674 | -2,063 | -2,234 | -2,211 | -2,585 | -2,730 |
| 2018 | -2,958 | -2,235 | -2,863 | -2,412 | -660 | -2,236 | -2,488 | -2,938 | -2,388 | -1,922 | -2,716 | -3,078 |
| 2019 | -1,252 | -2,384 | -1,507 | -2,105 | -2,099 | -2,268 | -475 | -1,864 | -1,448 | -1,792 | -1,318 | -631 |
| 2020 | -2,602 | -2,399 | -1,510 | -3,574 | -2,439 | -2,086 | -321 | -1,097 | -621 | -2,278 | -845 | -2,906 |
| 2021 | -773 | -2,346 | -1,713 | -1,595 | -2,052 | -2,516 | -2,466 | -3,983 | -1,978 | -2,907 | -1,549 | -2,307 |
| 2022 | -278 | -1,958 | -1,989 | -886 | -2,004 | -1,982 | -2,032 | -2,331 | -1,477 | -1,550 | -1,002 | -2,996 |
| 2023 | -1,830 | -1,443 | -2,161 | -505 | -1,541 | -2,943 | -1,507 | -1,747 | 504 | -2,452 | -1,419 | -2,354 |
| 2024 | -2,251 | |||||||||||
| - = No Data Reported; -- = Not Applicable; NA = Not Available; W = Withheld to avoid disclosure of individual company data. |
| Release Date: 3/29/2024 |
| Next Release Date: 4/30/2024 |