|
Download Data (XLS File) |
|
||||||||
|
||||||||
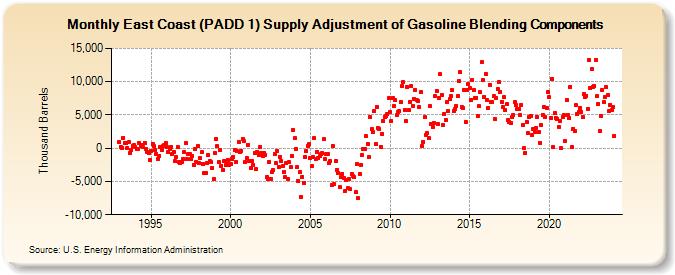
| East Coast (PADD 1) Supply Adjustment of Gasoline Blending Components (Thousand Barrels) | ||||||||
| Year | Jan | Feb | Mar | Apr | May | Jun | Jul | Aug | Sep | Oct | Nov | Dec |
|---|---|---|---|---|---|---|---|---|---|---|---|---|
| 1993 | 917 | 202 | 9 | 1,576 | 793 | 719 | 15 | 890 | -716 | -275 | 360 | 474 |
| 1994 | 215 | -84 | -83 | 787 | 386 | 434 | 129 | 828 | -113 | -514 | -779 | -1,760 |
| 1995 | -353 | 620 | 267 | -278 | -846 | -1,649 | -1,131 | 113 | -227 | 316 | 463 | 758 |
| 1996 | 157 | -623 | -54 | 231 | -838 | -541 | -1,974 | -1,362 | 205 | -2,074 | -2,262 | -2,056 |
| 1997 | -1,594 | -554 | 776 | -1,619 | -853 | -916 | -1,608 | -1,143 | -2,469 | -97 | -2,020 | 319 |
| 1998 | -2,245 | -1,517 | -614 | -2,362 | -3,685 | -3,672 | -2,263 | -1,051 | -1,923 | -2,135 | -2,934 | -4,621 |
| 1999 | -659 | 1,364 | 257 | -2,087 | -256 | -2,608 | -3,268 | -1,896 | -2,536 | -1,963 | -1,743 | -2,506 |
| 2000 | -2,316 | -1,688 | -1,271 | -221 | -2,101 | -495 | 984 | -570 | -413 | 1,430 | 1,069 | -2,110 |
| 2001 | -1,510 | 538 | -1,913 | -2,992 | -1,920 | -2,491 | -751 | -3,106 | -504 | -1,033 | 188 | -734 |
| 2002 | -1,107 | -717 | -972 | -4,301 | -4,655 | -2,099 | -4,585 | -3,615 | -3,293 | -837 | -2,238 | -413 |
| 2003 | -2,800 | -1,310 | -1,947 | -2,658 | -3,509 | -4,342 | -2,233 | -4,635 | -2,134 | -2,902 | -1,106 | 2,709 |
| 2004 | 1,462 | -116 | -2,827 | -4,946 | -3,607 | -7,318 | -4,266 | -5,224 | -1,263 | -493 | 345 | 573 |
| 2005 | -1,457 | -2,738 | -1,354 | 1,461 | -1,690 | -508 | -1,534 | -1,199 | -929 | -732 | 1,317 | -1,676 |
| 2006 | -939 | -835 | -2,224 | -1,930 | -5,473 | 311 | -5,361 | -1,950 | -3,228 | -3,671 | -5,873 | -4,374 |
| 2007 | -3,826 | -4,459 | -6,498 | -4,731 | -6,039 | -4,689 | -6,177 | -3,814 | -4,238 | -4,397 | -6,639 | -2,418 |
| 2008 | -7,491 | -3,809 | -2,506 | -1,027 | -62 | -79 | 1,762 | 627 | -1,388 | 4,686 | 2,859 | 2,372 |
| 2009 | 5,584 | 600 | 6,192 | 3,075 | 2,902 | 224 | 2,195 | 4,080 | 4,712 | 4,802 | 5,064 | 7,499 |
| 2010 | 5,465 | 4,053 | 7,538 | 6,349 | 7,171 | 4,932 | 5,454 | 5,536 | 6,897 | 9,321 | 9,896 | 5,800 |
| 2011 | 4,071 | 9,160 | 5,726 | 6,976 | 9,347 | 6,370 | 7,443 | 8,807 | 7,269 | 7,165 | 6,195 | 8,397 |
| 2012 | 393 | 998 | 4,625 | 2,004 | 2,281 | 1,460 | 6,335 | 3,692 | 3,144 | 3,849 | 7,852 | 8,637 |
| 2013 | 3,664 | 7,501 | 11,103 | 8,006 | 3,527 | 5,182 | 4,255 | 6,934 | 5,619 | 7,344 | 7,875 | 8,712 |
| 2014 | 5,640 | 5,878 | 6,326 | 7,777 | 10,076 | 11,412 | 6,165 | 5,971 | 8,814 | 3,974 | 8,672 | 9,584 |
| 2015 | 9,076 | 7,250 | 10,191 | 8,709 | 7,483 | 7,586 | 4,868 | 6,266 | 8,422 | 12,909 | 10,216 | 7,724 |
| 2016 | 11,189 | 7,224 | 6,034 | 9,539 | 7,004 | 6,968 | 7,772 | 4,335 | 7,573 | 8,920 | 10,003 | 8,501 |
| 2017 | 6,983 | 6,198 | 7,683 | 5,665 | 6,584 | 4,218 | 3,944 | 3,834 | 4,647 | 5,026 | 6,888 | 6,539 |
| 2018 | 5,911 | 5,878 | 4,968 | 6,548 | 3,536 | 10 | -714 | 3,970 | 2,259 | 4,641 | 4,826 | 1,908 |
| 2019 | 2,844 | 2,425 | 3,083 | 4,756 | 2,411 | 836 | 3,473 | 5,017 | 6,183 | 4,722 | 6,096 | 8,422 |
| 2020 | 7,689 | 4,588 | 10,473 | 176 | 5,272 | 4,566 | 4,411 | 3,234 | 4,122 | -44 | 4,714 | 4,964 |
| 2021 | 1,006 | 7,184 | 4,996 | 4,495 | 9,254 | 115 | 2,931 | 2,647 | 6,419 | 5,118 | 5,429 | 6,093 |
| 2022 | 5,454 | 4,640 | 8,112 | 7,751 | 7,896 | 5,936 | 13,252 | 9,072 | 11,918 | 9,237 | 9,341 | 13,184 |
| 2023 | 7,789 | 6,647 | 2,512 | 4,904 | 8,754 | 6,872 | 7,735 | 9,179 | 7,949 | 5,535 | 6,534 | 5,770 |
| 2024 | 6,154 | |||||||||||
| - = No Data Reported; -- = Not Applicable; NA = Not Available; W = Withheld to avoid disclosure of individual company data. |
| Release Date: 3/29/2024 |
| Next Release Date: 4/30/2024 |