|
Download Data (XLS File) |
|
||||||||
|
||||||||
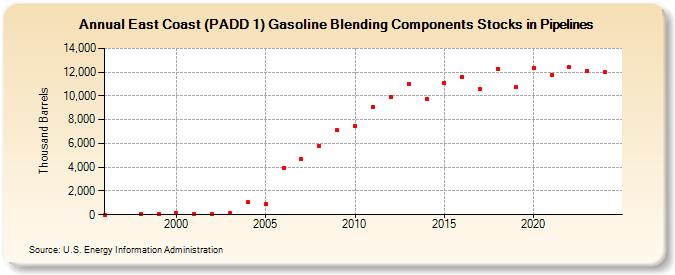
| East Coast (PADD 1) Gasoline Blending Components Stocks in Pipelines (Thousand Barrels) | ||||||||
| Decade | Year-0 | Year-1 | Year-2 | Year-3 | Year-4 | Year-5 | Year-6 | Year-7 | Year-8 | Year-9 |
|---|---|---|---|---|---|---|---|---|---|---|
| 1990's | 8 | 66 | 75 | |||||||
| 2000's | 110 | 90 | 85 | 106 | 1,086 | 876 | 3,933 | 4,653 | 5,805 | 7,092 |
| 2010's | 7,465 | 9,101 | 9,906 | 11,021 | 9,781 | 11,087 | 11,625 | 10,578 | 12,269 | 10,770 |
| 2020's | 12,381 | 11,766 | 12,408 | 12,110 |
| - = No Data Reported; -- = Not Applicable; NA = Not Available; W = Withheld to avoid disclosure of individual company data. |
| Release Date: 4/30/2024 |
| Next Release Date: 8/30/2024 |