|
Download Data (XLS File) |
|
||||||||
|
||||||||
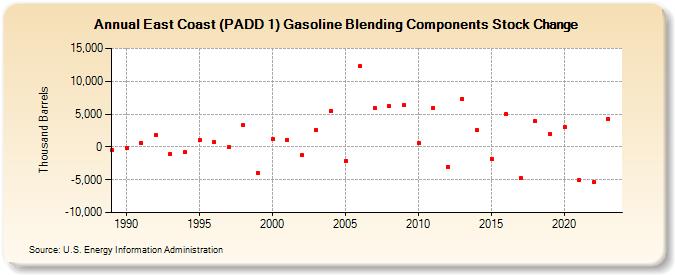
| East Coast (PADD 1) Gasoline Blending Components Stock Change (Thousand Barrels) | ||||||||
| Decade | Year-0 | Year-1 | Year-2 | Year-3 | Year-4 | Year-5 | Year-6 | Year-7 | Year-8 | Year-9 |
|---|---|---|---|---|---|---|---|---|---|---|
| 1980's | -483 | |||||||||
| 1990's | -203 | 629 | 1,749 | -1,037 | -824 | 1,007 | 712 | -74 | 3,271 | -3,952 |
| 2000's | 1,126 | 1,125 | -1,268 | 2,559 | 5,487 | -2,120 | 12,312 | 5,867 | 6,165 | 6,398 |
| 2010's | 524 | 5,958 | -2,997 | 7,323 | 2,509 | -1,799 | 5,003 | -4,750 | 3,877 | 1,968 |
| 2020's | 2,978 | -5,046 | -5,410 | 4,217 |
| - = No Data Reported; -- = Not Applicable; NA = Not Available; W = Withheld to avoid disclosure of individual company data. |
| Release Date: 3/29/2024 |
| Next Release Date: 8/30/2024 |