|
Download Data (XLS File) |
|
||||||||
|
||||||||
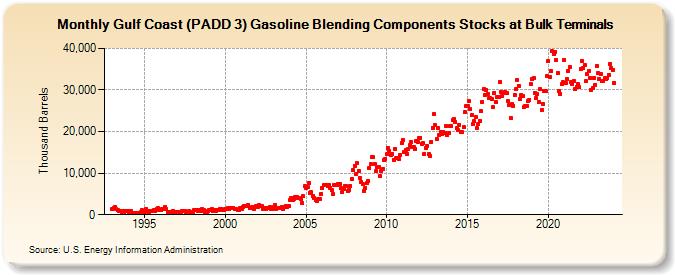
| Gulf Coast (PADD 3) Gasoline Blending Components Stocks at Bulk Terminals (Thousand Barrels) | ||||||||
| Year | Jan | Feb | Mar | Apr | May | Jun | Jul | Aug | Sep | Oct | Nov | Dec |
|---|---|---|---|---|---|---|---|---|---|---|---|---|
| 1993 | 1,412 | 1,704 | 1,828 | 1,352 | 1,035 | 780 | 823 | 646 | 923 | 405 | 795 | 933 |
| 1994 | 755 | 775 | 918 | 355 | 499 | 375 | 374 | 365 | 444 | 547 | 1,044 | 985 |
| 1995 | 588 | 1,338 | 892 | 712 | 861 | 849 | 843 | 1,179 | 922 | 1,380 | 1,597 | 1,126 |
| 1996 | 1,057 | 1,327 | 1,484 | 1,826 | 1,351 | 673 | 530 | 664 | 756 | 999 | 695 | 635 |
| 1997 | 650 | 680 | 723 | 755 | 859 | 789 | 806 | 741 | 737 | 781 | 747 | 632 |
| 1998 | 685 | 1,049 | 1,023 | 1,085 | 1,013 | 1,017 | 999 | 1,341 | 1,077 | 611 | 706 | 890 |
| 1999 | 1,107 | 1,140 | 1,379 | 1,010 | 1,073 | 962 | 1,018 | 1,226 | 1,390 | 1,416 | 1,112 | 1,063 |
| 2000 | 1,368 | 1,279 | 1,514 | 1,276 | 1,567 | 1,584 | 1,683 | 1,458 | 1,362 | 1,251 | 1,222 | 1,509 |
| 2001 | 1,331 | 1,902 | 2,198 | 2,117 | 2,204 | 2,298 | 1,599 | 1,594 | 1,767 | 1,369 | 1,791 | 2,146 |
| 2002 | 1,929 | 2,223 | 2,007 | 2,024 | 1,423 | 1,615 | 1,483 | 1,530 | 1,656 | 1,884 | 1,261 | 1,293 |
| 2003 | 1,911 | 2,298 | 1,438 | 1,619 | 1,602 | 1,662 | 1,873 | 1,373 | 1,795 | 2,128 | 1,854 | 2,001 |
| 2004 | 3,563 | 4,117 | 3,456 | 3,744 | 4,156 | 4,319 | 4,088 | 4,083 | 3,680 | 2,833 | 4,433 | 6,816 |
| 2005 | 6,316 | 6,620 | 7,647 | 5,169 | 5,357 | 4,554 | 4,089 | 3,580 | 3,345 | 3,851 | 3,796 | 5,011 |
| 2006 | 6,469 | 7,046 | 7,123 | 7,171 | 6,991 | 7,163 | 6,540 | 5,975 | 4,955 | 7,141 | 7,149 | 7,228 |
| 2007 | 7,380 | 7,392 | 6,371 | 5,467 | 6,121 | 6,812 | 6,888 | 5,625 | 6,044 | 6,906 | 8,587 | 10,707 |
| 2008 | 11,816 | 9,791 | 12,363 | 10,628 | 8,847 | 7,894 | 7,390 | 5,583 | 6,517 | 7,533 | 8,167 | 11,217 |
| 2009 | 12,154 | 13,908 | 13,784 | 12,191 | 10,402 | 11,564 | 11,462 | 9,302 | 10,541 | 11,038 | 13,096 | 13,517 |
| 2010 | 14,518 | 16,161 | 15,314 | 14,278 | 14,715 | 13,253 | 15,891 | 13,626 | 13,691 | 13,401 | 14,366 | 17,195 |
| 2011 | 17,981 | 15,162 | 15,680 | 14,701 | 15,847 | 16,741 | 17,558 | 16,282 | 16,336 | 15,814 | 17,754 | 17,524 |
| 2012 | 18,378 | 18,501 | 17,076 | 17,362 | 14,649 | 16,151 | 16,610 | 14,545 | 14,227 | 17,547 | 20,916 | 24,162 |
| 2013 | 21,546 | 18,224 | 20,877 | 19,160 | 19,861 | 19,474 | 19,965 | 19,555 | 21,358 | 19,228 | 19,694 | 21,369 |
| 2014 | 21,312 | 22,720 | 22,960 | 22,266 | 20,814 | 20,299 | 21,664 | 19,875 | 19,948 | 21,011 | 24,707 | 26,029 |
| 2015 | 26,213 | 27,280 | 25,420 | 23,942 | 21,755 | 22,468 | 23,548 | 20,830 | 21,719 | 22,569 | 24,828 | 27,168 |
| 2016 | 30,206 | 28,875 | 30,062 | 29,145 | 28,007 | 27,969 | 27,731 | 25,830 | 29,285 | 27,141 | 28,393 | 28,315 |
| 2017 | 31,934 | 29,590 | 28,623 | 29,256 | 29,507 | 29,226 | 27,334 | 26,477 | 23,224 | 26,596 | 26,231 | 28,869 |
| 2018 | 30,163 | 32,320 | 31,027 | 27,824 | 28,784 | 28,643 | 25,841 | 26,125 | 26,229 | 27,412 | 27,696 | 31,366 |
| 2019 | 32,524 | 32,797 | 29,381 | 28,062 | 28,977 | 27,095 | 30,133 | 25,251 | 26,687 | 29,836 | 29,727 | 33,347 |
| 2020 | 36,924 | 33,232 | 34,474 | 39,278 | 38,634 | 39,214 | 37,128 | 34,199 | 29,647 | 29,125 | 31,364 | 31,845 |
| 2021 | 37,189 | 31,687 | 32,531 | 34,620 | 35,496 | 31,854 | 31,352 | 32,162 | 30,265 | 30,697 | 31,394 | 30,700 |
| 2022 | 34,993 | 37,052 | 35,357 | 36,034 | 32,066 | 33,813 | 34,462 | 32,949 | 30,072 | 30,405 | 32,896 | 31,275 |
| 2023 | 35,766 | 34,046 | 32,659 | 33,925 | 32,180 | 32,165 | 32,807 | 32,607 | 32,898 | 33,672 | 36,347 | 35,178 |
| 2024 | 34,777 | |||||||||||
| - = No Data Reported; -- = Not Applicable; NA = Not Available; W = Withheld to avoid disclosure of individual company data. |
| Release Date: 3/29/2024 |
| Next Release Date: 4/30/2024 |