|
Download Data (XLS File) |
|
||||||||
|
||||||||
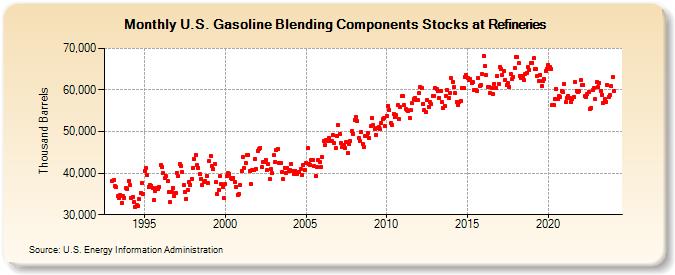
| U.S. Gasoline Blending Components Stocks at Refineries (Thousand Barrels) | ||||||||
| Year | Jan | Feb | Mar | Apr | May | Jun | Jul | Aug | Sep | Oct | Nov | Dec |
|---|---|---|---|---|---|---|---|---|---|---|---|---|
| 1993 | 38,169 | 38,328 | 36,796 | 36,563 | 34,429 | 33,963 | 34,753 | 32,882 | 34,415 | 34,030 | 36,419 | 36,190 |
| 1994 | 37,990 | 37,113 | 33,996 | 34,172 | 33,029 | 31,954 | 32,234 | 32,126 | 33,713 | 35,302 | 37,628 | 34,992 |
| 1995 | 40,615 | 41,345 | 39,491 | 36,736 | 37,177 | 36,991 | 36,466 | 33,578 | 35,786 | 36,519 | 36,277 | 36,764 |
| 1996 | 41,848 | 41,550 | 39,980 | 38,724 | 39,260 | 38,178 | 35,453 | 33,005 | 35,461 | 36,461 | 34,391 | 35,295 |
| 1997 | 40,116 | 39,231 | 42,077 | 41,781 | 40,235 | 37,142 | 35,570 | 33,815 | 35,983 | 37,888 | 37,250 | 38,635 |
| 1998 | 41,297 | 43,478 | 44,353 | 41,889 | 41,317 | 39,733 | 38,654 | 37,143 | 37,972 | 38,089 | 39,376 | 37,648 |
| 1999 | 42,887 | 44,226 | 41,788 | 40,919 | 42,193 | 37,781 | 34,909 | 35,893 | 39,226 | 37,414 | 36,712 | 33,960 |
| 2000 | 37,411 | 39,429 | 40,073 | 39,810 | 38,725 | 38,527 | 38,895 | 37,912 | 36,759 | 34,819 | 34,984 | 37,122 |
| 2001 | 40,590 | 43,842 | 41,188 | 42,477 | 44,306 | 44,321 | 40,539 | 37,316 | 40,801 | 40,703 | 43,450 | 41,036 |
| 2002 | 45,392 | 45,714 | 46,112 | 41,463 | 42,620 | 42,617 | 43,261 | 40,651 | 42,250 | 38,594 | 40,926 | 39,964 |
| 2003 | 44,272 | 42,743 | 45,533 | 45,796 | 42,507 | 42,476 | 40,193 | 38,522 | 41,351 | 40,077 | 41,256 | 40,429 |
| 2004 | 40,650 | 42,180 | 40,527 | 39,833 | 40,520 | 39,903 | 40,312 | 40,276 | 41,077 | 39,629 | 42,073 | 40,842 |
| 2005 | 42,448 | 45,967 | 42,279 | 42,061 | 43,112 | 43,119 | 41,665 | 39,201 | 41,583 | 43,142 | 42,570 | 41,490 |
| 2006 | 43,846 | 47,634 | 46,686 | 48,046 | 47,830 | 48,452 | 47,691 | 47,635 | 49,139 | 47,227 | 46,002 | 48,908 |
| 2007 | 51,485 | 49,417 | 47,302 | 46,202 | 46,693 | 46,071 | 47,541 | 44,738 | 46,949 | 47,705 | 50,062 | 49,420 |
| 2008 | 52,829 | 53,590 | 52,468 | 48,375 | 47,631 | 49,845 | 46,936 | 46,211 | 48,995 | 49,006 | 49,696 | 48,438 |
| 2009 | 51,314 | 53,213 | 51,608 | 50,562 | 49,266 | 50,780 | 51,124 | 50,510 | 52,044 | 52,901 | 53,161 | 51,236 |
| 2010 | 53,839 | 56,146 | 55,291 | 52,023 | 51,659 | 54,234 | 53,393 | 53,938 | 56,325 | 53,067 | 55,836 | 58,457 |
| 2011 | 58,506 | 56,385 | 55,481 | 55,144 | 55,049 | 53,346 | 55,109 | 56,793 | 57,785 | 58,164 | 57,593 | 57,608 |
| 2012 | 59,232 | 60,715 | 60,388 | 56,714 | 55,070 | 54,821 | 57,636 | 55,906 | 57,048 | 56,604 | 58,606 | 58,580 |
| 2013 | 60,446 | 60,170 | 59,703 | 58,089 | 59,776 | 57,074 | 55,678 | 56,153 | 58,537 | 59,954 | 58,139 | 59,221 |
| 2014 | 62,777 | 62,025 | 60,598 | 59,312 | 57,194 | 56,403 | 57,065 | 57,433 | 60,544 | 60,424 | 63,049 | 63,574 |
| 2015 | 62,825 | 62,279 | 62,582 | 61,686 | 61,851 | 60,007 | 59,938 | 59,756 | 62,834 | 60,932 | 61,292 | 63,900 |
| 2016 | 68,184 | 65,741 | 63,566 | 60,705 | 60,796 | 59,296 | 60,535 | 59,047 | 61,548 | 60,547 | 63,316 | 61,475 |
| 2017 | 65,533 | 65,028 | 63,623 | 64,463 | 62,442 | 61,248 | 61,694 | 60,779 | 63,878 | 62,541 | 63,228 | 65,302 |
| 2018 | 68,012 | 67,865 | 66,369 | 63,380 | 62,867 | 63,335 | 62,368 | 63,743 | 64,166 | 65,574 | 64,921 | 66,572 |
| 2019 | 66,598 | 67,625 | 64,940 | 64,945 | 63,480 | 62,110 | 63,715 | 60,990 | 62,167 | 62,674 | 64,602 | 65,117 |
| 2020 | 66,074 | 65,601 | 64,931 | 56,433 | 56,341 | 57,909 | 60,324 | 57,775 | 58,605 | 58,350 | 59,820 | 59,579 |
| 2021 | 61,479 | 57,129 | 58,188 | 58,627 | 58,089 | 57,070 | 57,885 | 58,428 | 61,935 | 59,815 | 59,419 | 59,737 |
| 2022 | 62,297 | 61,108 | 61,315 | 58,432 | 58,193 | 58,941 | 59,413 | 55,446 | 55,756 | 59,952 | 60,579 | 57,743 |
| 2023 | 61,803 | 60,618 | 61,713 | 59,800 | 58,862 | 56,932 | 57,754 | 57,154 | 61,248 | 58,405 | 58,871 | 60,905 |
| 2024 | 63,031 | |||||||||||
| - = No Data Reported; -- = Not Applicable; NA = Not Available; W = Withheld to avoid disclosure of individual company data. |
| Release Date: 3/29/2024 |
| Next Release Date: 4/30/2024 |