|
Download Data (XLS File) |
|
||||||||
|
||||||||
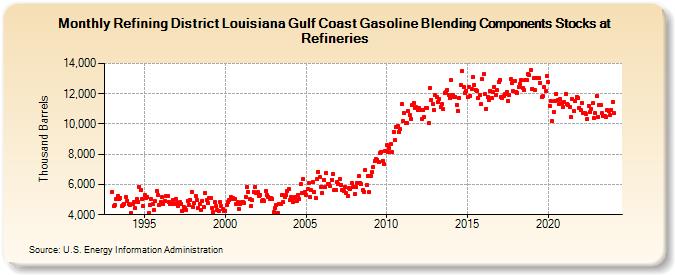
| Refining District Louisiana Gulf Coast Gasoline Blending Components Stocks at Refineries (Thousand Barrels) | ||||||||
| Year | Jan | Feb | Mar | Apr | May | Jun | Jul | Aug | Sep | Oct | Nov | Dec |
|---|---|---|---|---|---|---|---|---|---|---|---|---|
| 1993 | 5,530 | 4,546 | 4,631 | 5,035 | 5,253 | 5,018 | 5,123 | 4,573 | 4,625 | 4,728 | 5,175 | 4,929 |
| 1994 | 4,725 | 4,639 | 4,121 | 4,685 | 4,850 | 4,415 | 5,031 | 4,863 | 5,833 | 5,618 | 5,064 | 4,577 |
| 1995 | 5,303 | 5,096 | 5,182 | 4,099 | 4,670 | 5,008 | 4,693 | 4,281 | 4,875 | 5,586 | 5,284 | 4,667 |
| 1996 | 4,847 | 5,155 | 4,710 | 4,914 | 5,246 | 5,229 | 4,867 | 4,720 | 4,707 | 4,982 | 4,732 | 5,028 |
| 1997 | 4,766 | 4,595 | 4,819 | 4,709 | 4,272 | 4,538 | 4,442 | 4,315 | 4,923 | 4,668 | 4,995 | 5,528 |
| 1998 | 4,524 | 4,764 | 5,226 | 4,971 | 4,445 | 4,719 | 4,307 | 4,932 | 4,489 | 5,428 | 4,941 | 4,743 |
| 1999 | 5,127 | 5,115 | 4,435 | 4,147 | 4,827 | 4,568 | 4,342 | 4,257 | 4,835 | 4,563 | 4,383 | 4,259 |
| 2000 | 4,262 | 4,632 | 4,854 | 4,989 | 5,172 | 5,025 | 5,075 | 5,030 | 4,682 | 4,831 | 4,387 | 4,686 |
| 2001 | 4,808 | 4,816 | 4,806 | 5,178 | 5,835 | 5,508 | 5,008 | 4,608 | 4,956 | 5,524 | 5,849 | 5,422 |
| 2002 | 5,510 | 5,226 | 5,331 | 4,898 | 5,006 | 4,918 | 5,573 | 5,288 | 5,193 | 5,059 | 5,094 | 5,057 |
| 2003 | 4,159 | 4,411 | 4,619 | 4,134 | 4,714 | 4,708 | 5,301 | 4,839 | 5,177 | 5,326 | 5,578 | 5,703 |
| 2004 | 4,949 | 5,177 | 4,813 | 5,097 | 5,143 | 4,902 | 5,329 | 5,047 | 6,000 | 5,434 | 6,351 | 5,534 |
| 2005 | 5,331 | 5,671 | 6,109 | 5,175 | 5,603 | 6,142 | 5,494 | 5,105 | 6,330 | 6,856 | 6,474 | 5,854 |
| 2006 | 5,448 | 6,312 | 5,834 | 6,783 | 6,053 | 6,038 | 5,881 | 6,321 | 6,717 | 5,634 | 5,649 | 6,162 |
| 2007 | 6,053 | 6,343 | 5,960 | 5,623 | 5,572 | 5,850 | 5,405 | 5,244 | 5,751 | 5,731 | 6,073 | 5,809 |
| 2008 | 5,341 | 5,802 | 6,117 | 6,540 | 6,110 | 6,002 | 5,613 | 5,531 | 6,972 | 5,987 | 6,554 | 5,469 |
| 2009 | 6,566 | 6,795 | 7,155 | 7,523 | 7,666 | 7,646 | 7,465 | 8,052 | 8,173 | 7,572 | 7,321 | 8,216 |
| 2010 | 8,608 | 8,119 | 8,411 | 8,682 | 8,137 | 9,484 | 8,915 | 9,795 | 9,864 | 9,440 | 9,654 | 11,293 |
| 2011 | 10,199 | 10,708 | 10,032 | 10,044 | 10,826 | 10,566 | 10,334 | 11,262 | 11,380 | 11,028 | 11,108 | 10,916 |
| 2012 | 11,037 | 10,901 | 10,343 | 10,939 | 10,467 | 11,084 | 11,045 | 10,054 | 12,395 | 11,607 | 11,345 | 10,950 |
| 2013 | 11,916 | 11,808 | 11,457 | 11,653 | 11,151 | 11,299 | 10,968 | 12,074 | 12,113 | 12,274 | 11,945 | 11,700 |
| 2014 | 12,898 | 11,943 | 11,808 | 11,814 | 11,276 | 10,887 | 11,745 | 12,564 | 13,498 | 12,418 | 12,052 | 12,184 |
| 2015 | 11,785 | 12,455 | 11,873 | 12,310 | 13,080 | 12,602 | 12,276 | 12,190 | 11,736 | 11,922 | 11,294 | 12,989 |
| 2016 | 13,299 | 12,010 | 11,023 | 11,761 | 11,583 | 12,171 | 11,714 | 12,124 | 12,434 | 11,901 | 12,216 | 12,772 |
| 2017 | 12,929 | 11,794 | 11,737 | 11,842 | 11,956 | 12,119 | 11,543 | 11,899 | 12,946 | 12,699 | 12,166 | 12,873 |
| 2018 | 12,141 | 12,067 | 12,446 | 12,645 | 12,921 | 12,411 | 12,246 | 12,886 | 12,910 | 13,320 | 13,208 | 13,550 |
| 2019 | 12,336 | 13,039 | 12,229 | 13,047 | 13,044 | 13,012 | 12,703 | 11,771 | 11,826 | 12,428 | 12,161 | 13,176 |
| 2020 | 12,773 | 11,212 | 11,522 | 10,181 | 10,794 | 11,526 | 12,007 | 11,585 | 11,303 | 11,637 | 11,355 | 11,109 |
| 2021 | 11,447 | 11,984 | 11,325 | 11,243 | 11,130 | 10,458 | 11,635 | 10,847 | 11,499 | 11,790 | 11,738 | 11,076 |
| 2022 | 10,930 | 11,377 | 10,724 | 10,753 | 10,643 | 10,318 | 11,214 | 10,764 | 11,007 | 11,381 | 10,395 | 10,706 |
| 2023 | 11,840 | 10,484 | 11,230 | 11,263 | 10,715 | 10,515 | 10,538 | 10,463 | 10,940 | 10,880 | 10,565 | 10,945 |
| 2024 | 11,485 | |||||||||||
| - = No Data Reported; -- = Not Applicable; NA = Not Available; W = Withheld to avoid disclosure of individual company data. |
| Release Date: 3/29/2024 |
| Next Release Date: 4/30/2024 |