|
Download Data (XLS File) |
|
||||||||
|
||||||||
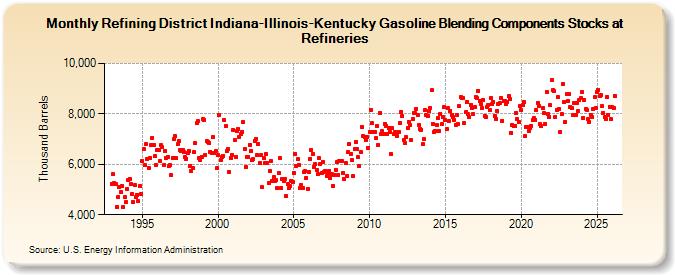
| Refining District Indiana-Illinois-Kentucky Gasoline Blending Components Stocks at Refineries (Thousand Barrels) | ||||||||
| Year | Jan | Feb | Mar | Apr | May | Jun | Jul | Aug | Sep | Oct | Nov | Dec |
|---|---|---|---|---|---|---|---|---|---|---|---|---|
| 1993 | 5,236 | 5,602 | 5,249 | 5,213 | 4,313 | 4,706 | 5,090 | 4,895 | 5,156 | 4,311 | 4,685 | 4,500 |
| 1994 | 5,009 | 5,387 | 5,432 | 5,201 | 4,823 | 4,493 | 5,172 | 4,687 | 4,793 | 4,527 | 5,149 | 4,814 |
| 1995 | 6,148 | 6,606 | 5,954 | 6,797 | 6,200 | 5,857 | 6,262 | 6,753 | 7,055 | 6,776 | 6,317 | 5,971 |
| 1996 | 6,582 | 6,555 | 6,132 | 6,752 | 6,670 | 5,966 | 6,522 | 6,254 | 6,285 | 5,920 | 5,961 | 5,559 |
| 1997 | 6,258 | 7,000 | 7,104 | 6,241 | 6,793 | 6,917 | 6,581 | 6,517 | 6,586 | 6,481 | 6,273 | 6,225 |
| 1998 | 6,438 | 6,544 | 5,949 | 5,749 | 5,859 | 6,487 | 6,831 | 7,620 | 7,708 | 6,237 | 6,187 | 6,298 |
| 1999 | 7,780 | 7,769 | 6,351 | 6,917 | 6,891 | 6,846 | 6,507 | 6,440 | 7,067 | 6,452 | 6,511 | 5,836 |
| 2000 | 6,357 | 7,963 | 6,163 | 6,290 | 6,338 | 7,753 | 7,510 | 6,547 | 6,616 | 5,705 | 6,269 | 6,384 |
| 2001 | 7,364 | 6,948 | 6,299 | 7,319 | 7,394 | 7,096 | 7,202 | 7,291 | 7,665 | 6,607 | 5,904 | 6,273 |
| 2002 | 6,298 | 6,782 | 6,523 | 6,160 | 6,204 | 6,937 | 7,014 | 6,352 | 6,814 | 6,058 | 6,358 | 5,083 |
| 2003 | 6,251 | 6,061 | 6,422 | 6,043 | 5,258 | 5,737 | 6,124 | 5,341 | 5,494 | 5,341 | 5,369 | 5,051 |
| 2004 | 5,661 | 6,238 | 5,054 | 5,418 | 5,344 | 5,422 | 4,737 | 5,228 | 5,066 | 5,122 | 5,354 | 5,290 |
| 2005 | 5,657 | 6,422 | 5,948 | 6,191 | 5,989 | 5,073 | 5,174 | 5,043 | 5,678 | 5,717 | 5,476 | 5,036 |
| 2006 | 5,710 | 6,212 | 6,578 | 6,426 | 5,912 | 6,015 | 5,777 | 5,601 | 6,231 | 6,016 | 5,664 | 6,109 |
| 2007 | 5,714 | 5,749 | 5,531 | 5,620 | 5,742 | 5,476 | 5,611 | 5,153 | 5,589 | 5,780 | 6,075 | 5,585 |
| 2008 | 6,140 | 6,120 | 6,120 | 5,655 | 5,422 | 6,043 | 5,537 | 6,472 | 6,790 | 6,423 | 6,156 | 5,533 |
| 2009 | 6,606 | 6,891 | 6,626 | 6,275 | 5,926 | 6,471 | 7,492 | 7,127 | 7,103 | 6,955 | 7,096 | 6,663 |
| 2010 | 7,277 | 8,174 | 7,628 | 7,289 | 7,262 | 7,033 | 7,527 | 6,769 | 8,054 | 7,201 | 7,309 | 7,189 |
| 2011 | 7,614 | 7,520 | 7,183 | 7,460 | 7,292 | 6,399 | 7,424 | 7,188 | 7,283 | 7,189 | 7,129 | 7,298 |
| 2012 | 7,624 | 8,094 | 7,910 | 6,961 | 6,850 | 7,072 | 7,424 | 7,698 | 7,551 | 6,970 | 7,813 | 8,044 |
| 2013 | 8,021 | 8,189 | 7,939 | 7,569 | 7,407 | 7,375 | 6,799 | 6,993 | 8,150 | 7,957 | 7,927 | 8,102 |
| 2014 | 8,234 | 8,935 | 7,605 | 7,267 | 7,326 | 7,548 | 7,833 | 7,324 | 8,010 | 7,587 | 7,873 | 8,268 |
| 2015 | 7,764 | 7,405 | 8,227 | 7,708 | 8,116 | 7,968 | 7,879 | 7,769 | 7,575 | 7,966 | 7,615 | 8,303 |
| 2016 | 8,668 | 8,617 | 8,611 | 7,619 | 8,056 | 8,490 | 7,979 | 7,859 | 8,371 | 8,216 | 7,992 | 8,264 |
| 2017 | 8,658 | 8,620 | 8,915 | 8,505 | 8,412 | 8,234 | 8,556 | 7,917 | 7,870 | 8,282 | 8,370 | 8,140 |
| 2018 | 8,635 | 8,384 | 8,470 | 7,935 | 7,817 | 8,123 | 8,387 | 8,434 | 8,618 | 7,729 | 8,500 | 8,527 |
| 2019 | 8,385 | 8,476 | 8,696 | 8,585 | 7,261 | 7,578 | 7,500 | 7,522 | 8,037 | 7,791 | 7,696 | 8,307 |
| 2020 | 8,149 | 8,356 | 8,471 | 7,141 | 7,498 | 7,462 | 7,334 | 7,428 | 7,532 | 7,753 | 7,840 | 7,752 |
| 2021 | 8,144 | 8,439 | 8,328 | 7,589 | 7,512 | 8,222 | 8,034 | 7,592 | 8,888 | 8,001 | 7,864 | 8,333 |
| 2022 | 9,328 | 8,947 | 8,900 | 7,877 | 8,162 | 8,663 | 8,180 | 7,278 | 7,992 | 9,176 | 8,480 | 7,690 |
| 2023 | 8,788 | 8,525 | 8,783 | 8,277 | 8,228 | 7,965 | 8,438 | 7,938 | 8,442 | 8,099 | 8,543 | 8,667 |
| 2024 | 8,912 | |||||||||||
| - = No Data Reported; -- = Not Applicable; NA = Not Available; W = Withheld to avoid disclosure of individual company data. |
| Release Date: 3/29/2024 |
| Next Release Date: 4/30/2024 |