|
Download Data (XLS File) |
|
||||||||
|
||||||||
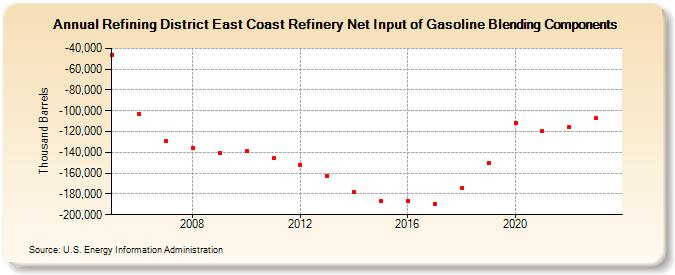
| Refining District East Coast Refinery Net Input of Gasoline Blending Components (Thousand Barrels) | ||||||||
| Decade | Year-0 | Year-1 | Year-2 | Year-3 | Year-4 | Year-5 | Year-6 | Year-7 | Year-8 | Year-9 |
|---|---|---|---|---|---|---|---|---|---|---|
| 2000's | -45,894 | -103,287 | -129,424 | -136,109 | -140,749 | |||||
| 2010's | -138,457 | -145,866 | -152,563 | -163,015 | -177,761 | -187,007 | -186,983 | -189,553 | -174,656 | -149,901 |
| 2020's | -111,764 | -119,133 | -116,046 | -107,318 |
| - = No Data Reported; -- = Not Applicable; NA = Not Available; W = Withheld to avoid disclosure of individual company data. |
| Release Date: 3/29/2024 |
| Next Release Date: 8/30/2024 |