|
Download Data (XLS File) |
|
||||||||
|
||||||||
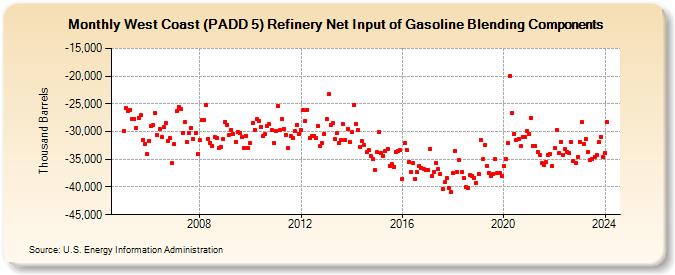
| West Coast (PADD 5) Refinery Net Input of Gasoline Blending Components (Thousand Barrels) | ||||||||
| Year | Jan | Feb | Mar | Apr | May | Jun | Jul | Aug | Sep | Oct | Nov | Dec |
|---|---|---|---|---|---|---|---|---|---|---|---|---|
| 2005 | -29,877 | -25,751 | -26,226 | -26,055 | -27,788 | -27,770 | -29,370 | -27,488 | -27,075 | -31,481 | -32,212 | -34,057 |
| 2006 | -31,657 | -28,913 | -28,797 | -26,611 | -30,685 | -29,515 | -31,024 | -29,210 | -28,483 | -31,782 | -31,235 | -35,664 |
| 2007 | -32,326 | -26,316 | -25,563 | -25,855 | -30,211 | -28,356 | -31,918 | -30,222 | -29,293 | -31,310 | -30,321 | -34,116 |
| 2008 | -31,609 | -27,942 | -27,965 | -25,167 | -31,272 | -32,019 | -32,587 | -31,022 | -31,160 | -32,908 | -32,751 | -31,332 |
| 2009 | -28,265 | -28,814 | -30,543 | -29,696 | -30,494 | -31,827 | -30,012 | -30,284 | -30,956 | -32,945 | -30,720 | -33,005 |
| 2010 | -32,135 | -28,419 | -29,635 | -27,746 | -28,025 | -29,162 | -30,737 | -30,529 | -28,980 | -28,700 | -29,654 | -32,034 |
| 2011 | -29,948 | -25,432 | -29,805 | -27,760 | -29,583 | -30,558 | -33,049 | -30,789 | -31,251 | -29,958 | -28,745 | -30,353 |
| 2012 | -29,789 | -26,184 | -28,096 | -26,067 | -31,199 | -30,752 | -30,751 | -31,184 | -29,028 | -32,590 | -32,134 | -30,458 |
| 2013 | -27,820 | -23,240 | -28,775 | -28,536 | -31,364 | -30,280 | -32,061 | -31,590 | -28,710 | -31,473 | -29,520 | -31,845 |
| 2014 | -30,046 | -25,178 | -28,658 | -29,730 | -32,698 | -31,724 | -32,385 | -33,674 | -33,258 | -34,378 | -34,916 | -36,895 |
| 2015 | -33,687 | -30,081 | -33,834 | -34,340 | -33,591 | -33,193 | -36,189 | -35,861 | -36,391 | -33,687 | -33,419 | -33,388 |
| 2016 | -38,475 | -32,134 | -33,275 | -35,523 | -37,372 | -35,633 | -38,563 | -37,371 | -36,160 | -36,606 | -36,684 | -37,000 |
| 2017 | -36,928 | -33,114 | -38,042 | -37,264 | -35,603 | -36,832 | -37,745 | -40,420 | -39,182 | -38,449 | -40,162 | -40,984 |
| 2018 | -37,525 | -33,441 | -37,340 | -35,147 | -37,299 | -38,340 | -40,032 | -40,220 | -37,874 | -38,043 | -38,367 | -39,247 |
| 2019 | -37,698 | -31,528 | -35,033 | -32,340 | -36,135 | -37,421 | -38,078 | -37,661 | -35,014 | -37,512 | -37,508 | -37,943 |
| 2020 | -36,253 | -35,007 | -32,063 | -19,957 | -26,593 | -30,402 | -31,584 | -31,280 | -32,666 | -30,955 | -30,962 | -29,989 |
| 2021 | -30,416 | -27,528 | -32,524 | -32,636 | -33,660 | -34,172 | -35,724 | -36,051 | -35,505 | -34,167 | -34,050 | -36,276 |
| 2022 | -32,932 | -29,667 | -33,942 | -31,835 | -34,185 | -33,217 | -33,720 | -33,905 | -31,815 | -35,345 | -35,754 | -34,565 |
| 2023 | -31,834 | -28,348 | -32,301 | -31,296 | -33,651 | -35,168 | -34,959 | -34,526 | -34,167 | -31,896 | -30,975 | -34,641 |
| 2024 | -33,931 | |||||||||||
| - = No Data Reported; -- = Not Applicable; NA = Not Available; W = Withheld to avoid disclosure of individual company data. |
| Release Date: 3/29/2024 |
| Next Release Date: 4/30/2024 |