|
Download Data (XLS File) |
|
||||||||
|
||||||||
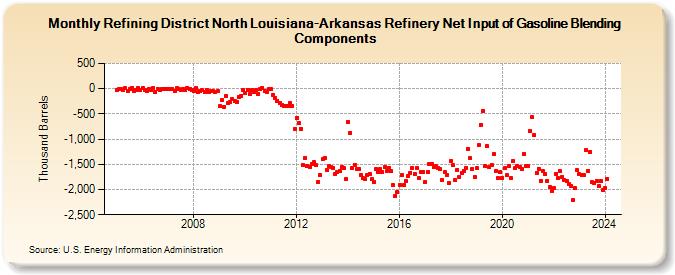
| Refining District North Louisiana-Arkansas Refinery Net Input of Gasoline Blending Components (Thousand Barrels) | ||||||||
| Year | Jan | Feb | Mar | Apr | May | Jun | Jul | Aug | Sep | Oct | Nov | Dec |
|---|---|---|---|---|---|---|---|---|---|---|---|---|
| 2005 | -20 | -4 | -11 | -20 | 10 | -55 | -13 | 17 | -43 | -34 | 12 | -30 |
| 2006 | 9 | -26 | -51 | 1 | -17 | 19 | -63 | 0 | -20 | -5 | -12 | 2 |
| 2007 | -14 | -1 | 3 | -38 | 8 | -12 | -23 | 0 | -21 | 23 | 2 | -28 |
| 2008 | -48 | 11 | -58 | -46 | -33 | -71 | -35 | -63 | -53 | -48 | -56 | -47 |
| 2009 | -350 | -231 | -355 | -150 | -291 | -258 | -213 | -252 | -257 | -164 | -140 | -27 |
| 2010 | -91 | -21 | -115 | -33 | -72 | -32 | -98 | -4 | 19 | -53 | -62 | -3 |
| 2011 | -7 | -124 | -181 | -236 | -293 | -320 | -336 | -353 | -346 | -288 | -342 | -793 |
| 2012 | -577 | -690 | -790 | -1,512 | -1,378 | -1,531 | -1,551 | -1,498 | -1,463 | -1,515 | -1,846 | -1,715 |
| 2013 | -1,403 | -1,374 | -1,606 | -1,530 | -1,548 | -1,568 | -1,689 | -1,651 | -1,636 | -1,555 | -1,582 | -1,793 |
| 2014 | -659 | -876 | -1,573 | -1,509 | -1,596 | -1,584 | -1,714 | -1,779 | -1,790 | -1,713 | -1,683 | -1,799 |
| 2015 | -1,849 | -1,603 | -1,658 | -1,598 | -1,652 | -1,549 | -1,640 | -1,564 | -1,635 | -1,919 | -2,128 | -2,044 |
| 2016 | -1,908 | -1,720 | -1,907 | -1,841 | -1,733 | -1,667 | -1,573 | -1,687 | -1,572 | -1,777 | -1,655 | -1,649 |
| 2017 | -1,849 | -1,662 | -1,490 | -1,487 | -1,558 | -1,542 | -1,573 | -1,598 | -1,812 | -1,659 | -1,719 | -1,863 |
| 2018 | -1,439 | -1,517 | -1,813 | -1,613 | -1,756 | -1,671 | -1,637 | -1,567 | -1,188 | -1,383 | -1,592 | -1,751 |
| 2019 | -1,581 | -1,118 | -711 | -439 | -1,542 | -1,145 | -1,557 | -1,511 | -1,298 | -1,627 | -1,774 | -1,655 |
| 2020 | -1,765 | -1,574 | -1,721 | -1,543 | -1,778 | -1,437 | -1,583 | -1,533 | -1,557 | -1,601 | -1,292 | -1,543 |
| 2021 | -1,538 | -848 | -566 | -922 | -1,665 | -1,586 | -1,822 | -1,639 | -1,694 | -1,824 | -1,950 | -2,028 |
| 2022 | -1,971 | -1,684 | -1,778 | -1,640 | -1,751 | -1,810 | -1,832 | -1,886 | -1,922 | -2,214 | -1,979 | -1,621 |
| 2023 | -1,694 | -1,713 | -1,710 | -1,225 | -1,637 | -1,249 | -1,860 | -1,868 | -1,828 | -1,939 | -1,839 | -2,001 |
| 2024 | -1,973 | |||||||||||
| - = No Data Reported; -- = Not Applicable; NA = Not Available; W = Withheld to avoid disclosure of individual company data. |
| Release Date: 3/29/2024 |
| Next Release Date: 4/30/2024 |