|
Download Data (XLS File) |
|
||||||||
|
||||||||
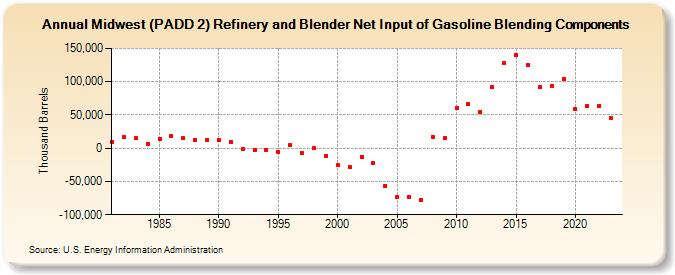
| Midwest (PADD 2) Refinery and Blender Net Input of Gasoline Blending Components (Thousand Barrels) | ||||||||
| Decade | Year-0 | Year-1 | Year-2 | Year-3 | Year-4 | Year-5 | Year-6 | Year-7 | Year-8 | Year-9 |
|---|---|---|---|---|---|---|---|---|---|---|
| 1980's | 9,520 | 16,832 | 15,829 | 6,339 | 14,011 | 18,418 | 14,789 | 12,872 | 12,039 | |
| 1990's | 11,635 | 9,991 | -1,010 | -3,425 | -2,936 | -6,158 | 5,050 | -7,566 | 167 | -11,208 |
| 2000's | -25,013 | -28,130 | -12,655 | -22,373 | -56,331 | -73,477 | -72,782 | -77,230 | 17,258 | 14,913 |
| 2010's | 60,205 | 66,172 | 54,316 | 91,218 | 127,693 | 140,066 | 125,061 | 91,542 | 93,471 | 104,469 |
| 2020's | 58,635 | 63,953 | 63,809 | 45,022 |
| - = No Data Reported; -- = Not Applicable; NA = Not Available; W = Withheld to avoid disclosure of individual company data. |
| Release Date: 3/29/2024 |
| Next Release Date: 8/30/2024 |