|
Download Data (XLS File) |
|
||||||||
|
||||||||
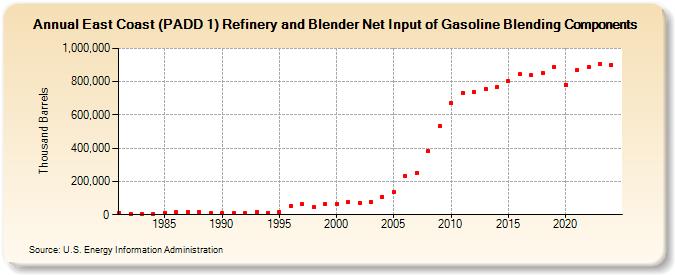
| East Coast (PADD 1) Refinery and Blender Net Input of Gasoline Blending Components (Thousand Barrels) | ||||||||
| Decade | Year-0 | Year-1 | Year-2 | Year-3 | Year-4 | Year-5 | Year-6 | Year-7 | Year-8 | Year-9 |
|---|---|---|---|---|---|---|---|---|---|---|
| 1980's | 11,520 | 5,065 | 5,648 | 5,768 | 13,167 | 13,874 | 13,754 | 16,141 | 9,707 | |
| 1990's | 9,650 | 10,219 | 11,044 | 14,959 | 9,062 | 15,473 | 51,992 | 63,777 | 46,310 | 63,069 |
| 2000's | 64,312 | 74,611 | 72,255 | 77,801 | 107,545 | 136,668 | 233,154 | 251,333 | 384,446 | 531,889 |
| 2010's | 669,400 | 731,997 | 740,636 | 756,154 | 766,393 | 802,255 | 843,752 | 837,744 | 853,367 | 889,849 |
| 2020's | 781,807 | 871,112 | 889,726 | 906,422 |
| - = No Data Reported; -- = Not Applicable; NA = Not Available; W = Withheld to avoid disclosure of individual company data. |
| Release Date: 3/29/2024 |
| Next Release Date: 8/30/2024 |