|
Download Data (XLS File) |
|
||||||||
|
||||||||
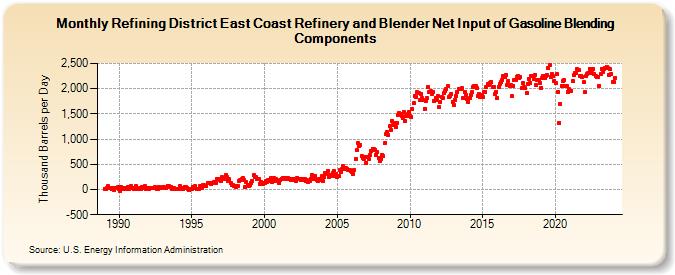
| Refining District East Coast Refinery and Blender Net Input of Gasoline Blending Components (Thousand Barrels per Day) | ||||||||
| Year | Jan | Feb | Mar | Apr | May | Jun | Jul | Aug | Sep | Oct | Nov | Dec |
|---|---|---|---|---|---|---|---|---|---|---|---|---|
| 1989 | 19 | 5 | 27 | 62 | 22 | 27 | 17 | 35 | -5 | 37 | 38 | 40 |
| 1990 | 12 | -25 | 48 | 19 | 27 | 38 | 1 | 47 | 1 | 50 | 63 | 37 |
| 1991 | 5 | 7 | 72 | 15 | 18 | 27 | 17 | 50 | 23 | 68 | 17 | 17 |
| 1992 | 26 | 10 | 35 | 31 | 32 | 28 | 40 | 20 | 18 | 57 | 31 | 38 |
| 1993 | 46 | 59 | 38 | 39 | 72 | 61 | 53 | 57 | 10 | 29 | 18 | 14 |
| 1994 | 14 | 18 | 63 | 29 | 33 | 10 | 45 | 42 | 39 | 9 | -16 | 15 |
| 1995 | 9 | 50 | 30 | 60 | 15 | 17 | 10 | 70 | 28 | 82 | 82 | 60 |
| 1996 | 61 | 122 | 122 | 128 | 118 | 138 | 140 | 149 | 135 | 209 | 206 | 182 |
| 1997 | 161 | 240 | 234 | 203 | 281 | 244 | 174 | 200 | 120 | 87 | 84 | 73 |
| 1998 | 54 | 72 | 61 | 166 | 182 | 208 | 225 | 193 | 58 | 150 | 82 | 66 |
| 1999 | 87 | 131 | 165 | 280 | 245 | 251 | 205 | 205 | 116 | 157 | 127 | 106 |
| 2000 | 136 | 162 | 155 | 186 | 170 | 223 | 152 | 163 | 222 | 207 | 169 | 169 |
| 2001 | 121 | 190 | 218 | 224 | 230 | 232 | 210 | 227 | 215 | 200 | 182 | 205 |
| 2002 | 209 | 181 | 177 | 237 | 203 | 212 | 183 | 211 | 196 | 216 | 172 | 181 |
| 2003 | 151 | 176 | 218 | 291 | 220 | 217 | 270 | 189 | 167 | 208 | 189 | 261 |
| 2004 | 164 | 246 | 335 | 298 | 374 | 254 | 295 | 271 | 335 | 370 | 273 | 309 |
| 2005 | 242 | 270 | 383 | 357 | 397 | 465 | 402 | 423 | 416 | 381 | 391 | 361 |
| 2006 | 340 | 314 | 383 | 603 | 779 | 914 | 866 | 883 | 666 | 627 | 615 | 653 |
| 2007 | 532 | 650 | 603 | 688 | 768 | 812 | 795 | 791 | 691 | 736 | 622 | 574 |
| 2008 | 601 | 692 | 657 | 916 | 1,092 | 1,140 | 1,084 | 1,252 | 1,187 | 1,368 | 1,286 | 1,318 |
| 2009 | 1,243 | 1,324 | 1,484 | 1,526 | 1,503 | 1,454 | 1,418 | 1,539 | 1,357 | 1,457 | 1,489 | 1,541 |
| 2010 | 1,463 | 1,435 | 1,600 | 1,707 | 1,848 | 1,833 | 1,926 | 1,906 | 1,771 | 1,893 | 1,807 | 1,775 |
| 2011 | 1,603 | 1,762 | 1,820 | 2,035 | 1,930 | 1,951 | 1,900 | 1,929 | 1,753 | 1,820 | 1,771 | 1,853 |
| 2012 | 1,628 | 1,736 | 1,833 | 1,810 | 1,907 | 1,954 | 2,000 | 2,048 | 1,833 | 1,856 | 1,902 | 1,745 |
| 2013 | 1,682 | 1,783 | 1,863 | 1,939 | 1,994 | 2,002 | 2,001 | 2,006 | 1,817 | 1,935 | 1,873 | 1,800 |
| 2014 | 1,744 | 1,812 | 1,878 | 1,928 | 2,038 | 2,046 | 2,056 | 2,014 | 1,862 | 1,901 | 1,833 | 1,866 |
| 2015 | 1,836 | 1,942 | 1,935 | 2,037 | 2,099 | 2,081 | 2,114 | 2,133 | 2,031 | 2,038 | 1,891 | 1,942 |
| 2016 | 1,814 | 2,041 | 2,101 | 2,133 | 2,172 | 2,243 | 2,237 | 2,281 | 2,079 | 2,159 | 2,045 | 2,074 |
| 2017 | 1,849 | 2,052 | 2,165 | 2,174 | 2,232 | 2,258 | 2,217 | 2,224 | 2,007 | 2,108 | 2,029 | 2,005 |
| 2018 | 1,917 | 2,099 | 2,200 | 2,120 | 2,247 | 2,261 | 2,190 | 2,275 | 2,080 | 2,174 | 2,171 | 2,111 |
| 2019 | 2,022 | 2,219 | 2,255 | 2,216 | 2,259 | 2,270 | 2,406 | 2,470 | 2,226 | 2,297 | 2,242 | 2,146 |
| 2020 | 2,110 | 2,284 | 1,940 | 1,324 | 1,695 | 2,059 | 2,148 | 2,172 | 2,063 | 2,053 | 1,943 | 1,998 |
| 2021 | 1,947 | 1,961 | 2,150 | 2,263 | 2,316 | 2,307 | 2,385 | 2,371 | 2,244 | 2,259 | 2,234 | 2,130 |
| 2022 | 1,932 | 2,244 | 2,289 | 2,305 | 2,397 | 2,364 | 2,305 | 2,391 | 2,293 | 2,242 | 2,234 | 2,239 |
| 2023 | 2,061 | 2,293 | 2,397 | 2,337 | 2,387 | 2,407 | 2,429 | 2,405 | 2,271 | 2,382 | 2,296 | 2,131 |
| 2024 | 2,125 | |||||||||||
| - = No Data Reported; -- = Not Applicable; NA = Not Available; W = Withheld to avoid disclosure of individual company data. |
| Release Date: 3/29/2024 |
| Next Release Date: 4/30/2024 |