|
Download Data (XLS File) |
|
||||||||
|
||||||||
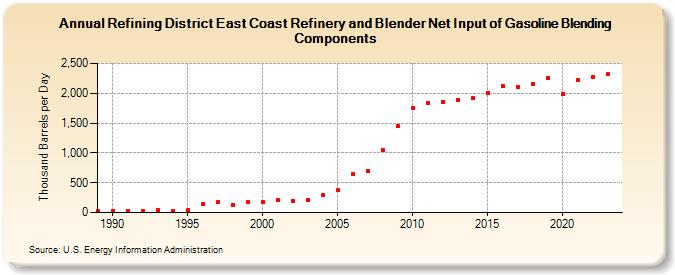
| Refining District East Coast Refinery and Blender Net Input of Gasoline Blending Components (Thousand Barrels per Day) | ||||||||
| Decade | Year-0 | Year-1 | Year-2 | Year-3 | Year-4 | Year-5 | Year-6 | Year-7 | Year-8 | Year-9 |
|---|---|---|---|---|---|---|---|---|---|---|
| 1980's | 27 | |||||||||
| 1990's | 27 | 28 | 31 | 41 | 25 | 43 | 143 | 175 | 127 | 173 |
| 2000's | 176 | 204 | 198 | 213 | 294 | 374 | 639 | 689 | 1,050 | 1,445 |
| 2010's | 1,749 | 1,844 | 1,855 | 1,892 | 1,916 | 2,007 | 2,115 | 2,110 | 2,154 | 2,253 |
| 2020's | 1,982 | 2,216 | 2,270 | 2,316 |
| - = No Data Reported; -- = Not Applicable; NA = Not Available; W = Withheld to avoid disclosure of individual company data. |
| Release Date: 3/29/2024 |
| Next Release Date: 8/30/2024 |