|
Download Data (XLS File) |
|
||||||||
|
||||||||
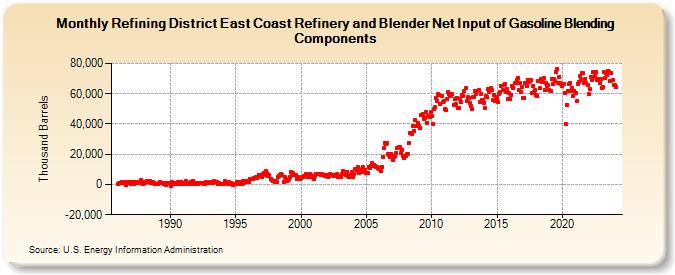
| Refining District East Coast Refinery and Blender Net Input of Gasoline Blending Components (Thousand Barrels) | ||||||||
| Year | Jan | Feb | Mar | Apr | May | Jun | Jul | Aug | Sep | Oct | Nov | Dec |
|---|---|---|---|---|---|---|---|---|---|---|---|---|
| 1986 | 496 | 759 | 1,238 | 1,112 | 1,394 | 1,086 | 1,821 | -67 | 930 | 1,897 | 1,759 | 1,403 |
| 1987 | 629 | 851 | 1,751 | 590 | 1,472 | 1,363 | 649 | 892 | 1,011 | 2,991 | 1,226 | 348 |
| 1988 | 1,344 | 1,147 | 1,492 | 2,153 | 1,796 | 2,203 | 1,245 | 1,697 | 1,669 | 881 | 414 | 305 |
| 1989 | 602 | 130 | 836 | 1,850 | 684 | 806 | 528 | 1,086 | -139 | 1,159 | 1,149 | 1,250 |
| 1990 | 369 | -688 | 1,476 | 555 | 839 | 1,132 | 28 | 1,453 | 18 | 1,552 | 1,897 | 1,147 |
| 1991 | 147 | 205 | 2,230 | 445 | 566 | 816 | 514 | 1,548 | 699 | 2,095 | 510 | 540 |
| 1992 | 807 | 295 | 1,098 | 940 | 983 | 853 | 1,228 | 612 | 539 | 1,774 | 937 | 1,174 |
| 1993 | 1,423 | 1,665 | 1,178 | 1,171 | 2,243 | 1,821 | 1,642 | 1,773 | 312 | 893 | 526 | 446 |
| 1994 | 443 | 499 | 1,966 | 883 | 1,012 | 287 | 1,387 | 1,297 | 1,172 | 264 | -475 | 475 |
| 1995 | 266 | 1,399 | 928 | 1,806 | 453 | 521 | 299 | 2,178 | 854 | 2,540 | 2,458 | 1,849 |
| 1996 | 1,890 | 3,533 | 3,791 | 3,836 | 3,658 | 4,133 | 4,355 | 4,615 | 4,059 | 6,490 | 6,177 | 5,630 |
| 1997 | 4,995 | 6,727 | 7,259 | 6,089 | 8,725 | 7,327 | 5,392 | 6,188 | 3,608 | 2,686 | 2,533 | 2,261 |
| 1998 | 1,672 | 2,014 | 1,904 | 4,978 | 5,629 | 6,248 | 6,981 | 5,980 | 1,738 | 4,664 | 2,470 | 2,061 |
| 1999 | 2,699 | 3,681 | 5,121 | 8,403 | 7,608 | 7,537 | 6,353 | 6,341 | 3,484 | 4,856 | 3,795 | 3,291 |
| 2000 | 4,204 | 4,692 | 4,802 | 5,569 | 5,276 | 6,689 | 4,713 | 5,067 | 6,663 | 6,411 | 5,082 | 5,231 |
| 2001 | 3,741 | 5,313 | 6,755 | 6,724 | 7,137 | 6,968 | 6,505 | 7,035 | 6,450 | 6,211 | 5,448 | 6,340 |
| 2002 | 6,483 | 5,068 | 5,485 | 7,122 | 6,286 | 6,366 | 5,671 | 6,537 | 5,867 | 6,694 | 5,145 | 5,601 |
| 2003 | 4,675 | 4,931 | 6,750 | 8,733 | 6,823 | 6,515 | 8,374 | 5,850 | 5,001 | 6,447 | 5,662 | 8,083 |
| 2004 | 5,093 | 7,126 | 10,373 | 8,942 | 11,581 | 7,607 | 9,133 | 8,405 | 10,062 | 11,461 | 8,181 | 9,584 |
| 2005 | 7,505 | 7,559 | 11,863 | 10,701 | 12,309 | 13,950 | 12,463 | 13,118 | 12,469 | 11,817 | 11,730 | 11,196 |
| 2006 | 10,530 | 8,781 | 11,879 | 18,096 | 24,164 | 27,410 | 26,846 | 27,369 | 19,984 | 19,430 | 18,452 | 20,236 |
| 2007 | 16,504 | 18,201 | 18,701 | 20,649 | 23,802 | 24,345 | 24,646 | 24,528 | 20,728 | 22,810 | 18,649 | 17,804 |
| 2008 | 18,625 | 20,069 | 20,354 | 27,481 | 33,856 | 34,207 | 33,618 | 38,802 | 35,612 | 42,396 | 38,578 | 40,846 |
| 2009 | 38,539 | 37,080 | 46,000 | 45,773 | 46,604 | 43,619 | 43,965 | 47,722 | 40,710 | 45,180 | 44,655 | 47,760 |
| 2010 | 45,366 | 40,175 | 49,609 | 51,212 | 57,288 | 54,981 | 59,707 | 59,075 | 53,142 | 58,687 | 54,221 | 55,028 |
| 2011 | 49,703 | 49,334 | 56,434 | 61,038 | 59,844 | 58,517 | 58,901 | 59,784 | 52,592 | 56,425 | 53,115 | 57,452 |
| 2012 | 50,455 | 50,357 | 56,837 | 54,296 | 59,128 | 58,626 | 62,007 | 63,481 | 54,981 | 57,551 | 57,046 | 54,108 |
| 2013 | 52,152 | 49,931 | 57,742 | 58,165 | 61,807 | 60,053 | 62,028 | 62,180 | 54,503 | 60,000 | 56,179 | 55,804 |
| 2014 | 54,069 | 50,722 | 58,206 | 57,845 | 63,181 | 61,386 | 63,742 | 62,448 | 55,856 | 58,921 | 54,996 | 57,852 |
| 2015 | 56,915 | 54,362 | 59,971 | 61,100 | 65,076 | 62,435 | 65,540 | 66,131 | 60,934 | 63,189 | 56,736 | 60,199 |
| 2016 | 56,237 | 59,182 | 65,134 | 63,994 | 67,344 | 67,300 | 69,350 | 70,712 | 62,366 | 66,927 | 61,356 | 64,306 |
| 2017 | 57,332 | 57,452 | 67,105 | 65,229 | 69,182 | 67,727 | 68,734 | 68,936 | 60,224 | 65,334 | 60,879 | 62,144 |
| 2018 | 59,437 | 58,766 | 68,202 | 63,590 | 69,656 | 67,840 | 67,877 | 70,531 | 62,408 | 67,387 | 65,121 | 65,446 |
| 2019 | 62,686 | 62,129 | 69,906 | 66,466 | 70,021 | 68,113 | 74,577 | 76,562 | 66,782 | 71,202 | 67,252 | 66,522 |
| 2020 | 65,417 | 66,230 | 60,155 | 39,714 | 52,558 | 61,767 | 66,601 | 67,322 | 61,904 | 63,642 | 58,278 | 61,947 |
| 2021 | 60,372 | 54,915 | 66,647 | 67,896 | 71,804 | 69,210 | 73,941 | 73,514 | 67,317 | 70,023 | 67,018 | 66,026 |
| 2022 | 59,892 | 62,837 | 70,974 | 69,163 | 74,315 | 70,925 | 71,446 | 74,128 | 68,803 | 69,504 | 67,016 | 69,409 |
| 2023 | 63,906 | 64,191 | 74,310 | 70,112 | 73,992 | 72,201 | 75,301 | 74,559 | 68,143 | 73,836 | 68,885 | 66,046 |
| 2024 | 65,885 | |||||||||||
| - = No Data Reported; -- = Not Applicable; NA = Not Available; W = Withheld to avoid disclosure of individual company data. |
| Release Date: 3/29/2024 |
| Next Release Date: 4/30/2024 |