|
Download Data (XLS File) |
|
||||||||
|
||||||||
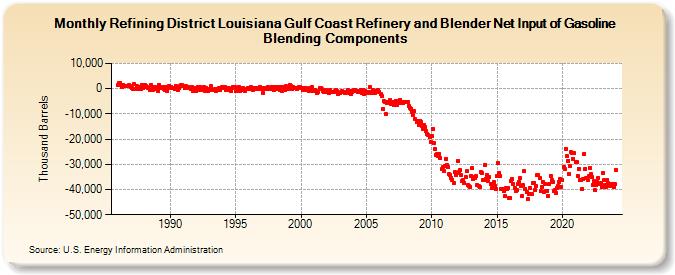
| Refining District Louisiana Gulf Coast Refinery and Blender Net Input of Gasoline Blending Components (Thousand Barrels) | ||||||||
| Year | Jan | Feb | Mar | Apr | May | Jun | Jul | Aug | Sep | Oct | Nov | Dec |
|---|---|---|---|---|---|---|---|---|---|---|---|---|
| 1986 | 1,282 | 2,150 | 2,274 | 1,381 | 806 | 1,591 | 1,246 | 900 | 1,209 | 1,212 | 1,276 | 1,155 |
| 1987 | 773 | 241 | -41 | 1,859 | -300 | 1,100 | 16 | -10 | 705 | -141 | 1,394 | 107 |
| 1988 | 495 | 1,328 | 1,084 | 531 | 157 | -336 | 1,547 | -204 | -442 | 521 | 604 | 423 |
| 1989 | -220 | -1,057 | 1,478 | 444 | 318 | 695 | -92 | -458 | 678 | -950 | 761 | 977 |
| 1990 | 350 | 673 | 403 | 99 | -320 | 1,195 | -167 | -350 | 101 | 987 | 1,455 | 1,282 |
| 1991 | 1,227 | 142 | 911 | 798 | 648 | 370 | 389 | -242 | 571 | -807 | 326 | 343 |
| 1992 | -1,085 | 665 | -659 | 692 | -558 | -231 | -268 | 694 | -845 | 440 | -233 | -1,064 |
| 1993 | 51 | 903 | -546 | -712 | -398 | -278 | -871 | -6 | -392 | 128 | -529 | 547 |
| 1994 | 359 | 277 | 781 | -585 | -174 | 298 | -594 | -74 | -781 | 467 | 824 | 733 |
| 1995 | -756 | 304 | -612 | 703 | -914 | -566 | -116 | 191 | -503 | -779 | 72 | 362 |
| 1996 | 396 | -171 | 689 | -218 | -328 | 239 | 291 | 213 | -28 | -165 | 728 | -269 |
| 1997 | 463 | -1,623 | -136 | 175 | 356 | -210 | 548 | 185 | -185 | 817 | -73 | -664 |
| 1998 | 754 | 299 | -107 | 541 | 434 | -415 | 537 | -741 | 807 | -575 | 884 | 373 |
| 1999 | -6 | 510 | 1,559 | 1,033 | -186 | 697 | 341 | 434 | -194 | 126 | 611 | 605 |
| 2000 | 133 | 247 | -325 | 102 | -377 | 98 | -438 | -782 | 248 | -595 | 634 | -870 |
| 2001 | -1,087 | -716 | -1,019 | -1,687 | -1,155 | 109 | 332 | -242 | -957 | -1,332 | -1,377 | -608 |
| 2002 | -947 | -1,380 | -1,539 | -649 | -1,148 | -1,249 | -1,297 | -1,043 | -466 | -962 | -1,945 | -1,600 |
| 2003 | -1,780 | -1,352 | -1,034 | -1,274 | -1,797 | -1,318 | -1,242 | -552 | -1,725 | -1,059 | -2,111 | -1,324 |
| 2004 | -1,018 | -693 | -550 | -968 | -1,419 | -1,318 | -1,062 | -505 | -1,743 | -502 | -2,104 | -992 |
| 2005 | -1,194 | -1,736 | -1,305 | 646 | -1,348 | -1,619 | -357 | -881 | -1,554 | -1,091 | -734 | -640 |
| 2006 | -1,234 | -2,142 | -2,983 | -8,224 | -4,993 | -5,189 | -10,040 | -5,763 | -5,385 | -5,130 | -4,661 | -5,883 |
| 2007 | -5,243 | -6,509 | -5,809 | -4,774 | -6,520 | -5,640 | -5,022 | -4,313 | -5,541 | -5,380 | -5,857 | -5,236 |
| 2008 | -5,154 | -5,301 | -5,137 | -6,752 | -7,477 | -7,883 | -9,080 | -10,583 | -9,034 | -12,139 | -13,345 | -12,918 |
| 2009 | -14,332 | -12,673 | -13,068 | -14,955 | -15,801 | -14,379 | -15,232 | -16,701 | -17,880 | -18,349 | -19,254 | -20,986 |
| 2010 | -18,738 | -15,960 | -21,632 | -24,062 | -26,240 | -26,037 | -26,596 | -25,878 | -27,558 | -32,002 | -31,234 | -32,503 |
| 2011 | -30,522 | -27,707 | -30,274 | -31,001 | -33,998 | -34,191 | -35,247 | -36,143 | -37,232 | -32,959 | -34,081 | -33,552 |
| 2012 | -28,497 | -33,028 | -32,090 | -34,391 | -36,703 | -36,207 | -37,344 | -34,915 | -32,771 | -38,203 | -38,517 | -38,891 |
| 2013 | -34,698 | -31,452 | -35,974 | -35,117 | -35,363 | -34,830 | -38,351 | -38,439 | -38,846 | -33,237 | -33,477 | -36,334 |
| 2014 | -36,035 | -30,177 | -35,647 | -34,091 | -36,652 | -34,976 | -37,779 | -39,573 | -37,798 | -37,150 | -38,476 | -39,668 |
| 2015 | -34,722 | -29,595 | -33,332 | -34,677 | -39,869 | -39,649 | -40,671 | -42,729 | -39,543 | -39,639 | -39,433 | -43,363 |
| 2016 | -43,461 | -36,663 | -35,867 | -37,814 | -39,366 | -40,408 | -40,226 | -37,685 | -36,954 | -35,577 | -38,712 | -42,701 |
| 2017 | -38,366 | -32,762 | -39,862 | -41,102 | -43,825 | -41,882 | -39,369 | -41,863 | -41,978 | -37,376 | -37,355 | -40,151 |
| 2018 | -38,618 | -34,154 | -34,402 | -35,297 | -40,726 | -39,040 | -36,993 | -40,992 | -37,630 | -40,524 | -40,436 | -42,647 |
| 2019 | -37,626 | -34,542 | -36,343 | -37,070 | -40,717 | -40,091 | -41,295 | -39,403 | -38,585 | -36,859 | -35,774 | -38,856 |
| 2020 | -36,246 | -31,168 | -31,803 | -23,800 | -26,816 | -28,560 | -33,758 | -30,629 | -25,304 | -25,610 | -27,983 | -25,596 |
| 2021 | -29,089 | -29,245 | -34,527 | -31,698 | -36,082 | -36,030 | -39,719 | -35,832 | -25,752 | -31,727 | -35,586 | -36,349 |
| 2022 | -34,775 | -31,336 | -33,975 | -35,092 | -38,027 | -36,645 | -40,367 | -38,179 | -37,034 | -35,529 | -37,792 | -37,347 |
| 2023 | -39,176 | -33,273 | -36,345 | -38,107 | -38,809 | -36,247 | -37,538 | -37,938 | -38,758 | -37,809 | -37,641 | -39,009 |
| 2024 | -37,919 | |||||||||||
| - = No Data Reported; -- = Not Applicable; NA = Not Available; W = Withheld to avoid disclosure of individual company data. |
| Release Date: 3/29/2024 |
| Next Release Date: 4/30/2024 |