|
Download Data (XLS File) |
|
||||||||
|
||||||||
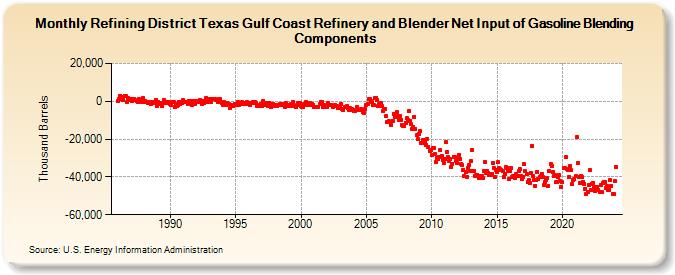
| Refining District Texas Gulf Coast Refinery and Blender Net Input of Gasoline Blending Components (Thousand Barrels) | ||||||||
| Year | Jan | Feb | Mar | Apr | May | Jun | Jul | Aug | Sep | Oct | Nov | Dec |
|---|---|---|---|---|---|---|---|---|---|---|---|---|
| 1986 | -77 | 1,447 | 3,062 | 1,373 | 2,393 | 876 | 2,880 | 2,766 | -409 | 1,537 | 857 | 1,171 |
| 1987 | 1,070 | 388 | 520 | 1,332 | 444 | -98 | -211 | 1,293 | 398 | 221 | -315 | 1,720 |
| 1988 | -546 | 38 | -545 | -638 | -990 | -528 | -1,210 | -372 | -721 | -965 | -297 | 858 |
| 1989 | -2,292 | -308 | -689 | -1,293 | -2,469 | -1,000 | 719 | -604 | -672 | -527 | -211 | -1,017 |
| 1990 | -1,377 | -1,995 | -584 | -308 | -2,860 | -1,593 | -2,294 | -1,923 | -302 | -1,408 | -235 | -817 |
| 1991 | 644 | -310 | -128 | -430 | -1,216 | 350 | -678 | 383 | -1,845 | 95 | -607 | -1,458 |
| 1992 | -27 | -231 | -155 | 881 | 60 | -1,374 | 331 | -1,099 | -207 | 1,678 | -121 | -328 |
| 1993 | 1,444 | -114 | 1,131 | 1,273 | 1,012 | 1,034 | 473 | 644 | -258 | 1,052 | 1,036 | -728 |
| 1994 | -1,797 | -194 | -1,455 | -2,201 | -938 | -1,655 | -1,657 | -3,514 | -1,865 | -2,416 | -2,512 | -1,517 |
| 1995 | -1,958 | -1,670 | -232 | -1,747 | -761 | -1,470 | -638 | -830 | -1,372 | -1,556 | -621 | -1,236 |
| 1996 | -854 | -2,001 | -939 | -705 | -245 | -753 | -640 | -885 | -2,326 | -2,716 | -1,946 | -1,299 |
| 1997 | -2,567 | -9 | -1,532 | -2,111 | -779 | -1,417 | -2,474 | -678 | -2,848 | -1,672 | -1,624 | -1,737 |
| 1998 | -2,325 | -2,216 | -2,578 | -1,949 | -1,713 | -1,267 | -2,172 | -1,433 | -2,087 | -3,066 | -917 | -1,922 |
| 1999 | -2,298 | -1,748 | -2,684 | -1,649 | -1,328 | -524 | -2,345 | -2,919 | -1,992 | -1,139 | -1,197 | -865 |
| 2000 | -2,525 | -2,973 | -2,872 | -1,586 | -2,053 | -335 | -1,558 | -2,182 | -1,038 | -1,839 | -1,451 | -1,840 |
| 2001 | -2,980 | -2,863 | -3,246 | -3,055 | -2,859 | -1,329 | -135 | -453 | -2,932 | -1,989 | -2,802 | -2,843 |
| 2002 | -2,794 | -1,156 | -1,986 | -1,788 | -2,044 | -3,179 | -2,590 | -1,993 | -2,380 | -2,744 | -3,758 | -3,372 |
| 2003 | -3,221 | -1,498 | -4,132 | -4,394 | -3,166 | -3,274 | -2,720 | -3,348 | -4,398 | -3,698 | -4,831 | -4,195 |
| 2004 | -4,365 | -4,926 | -4,890 | -3,027 | -4,568 | -4,427 | -4,551 | -4,252 | -4,786 | -5,429 | -6,065 | -4,235 |
| 2005 | -1,940 | -1,265 | 1,039 | 1,007 | 392 | -397 | -1,823 | -2,166 | 1,782 | 1,911 | 457 | -2,433 |
| 2006 | -1,356 | -1,152 | -2,447 | -5,309 | -4,104 | -3,850 | -8,018 | -10,751 | -10,846 | -10,674 | -10,977 | -12,504 |
| 2007 | -10,212 | -6,480 | -8,136 | -8,554 | -5,896 | -7,556 | -9,957 | -7,801 | -9,843 | -12,561 | -13,289 | -12,857 |
| 2008 | -11,438 | -8,745 | -9,759 | -5,143 | -10,293 | -12,142 | -14,567 | -13,699 | -8,098 | -14,465 | -18,027 | -20,199 |
| 2009 | -17,366 | -15,948 | -22,009 | -22,260 | -20,638 | -20,703 | -21,534 | -22,893 | -19,810 | -24,037 | -26,160 | -25,921 |
| 2010 | -28,648 | -24,456 | -24,622 | -27,701 | -31,963 | -29,866 | -30,546 | -29,259 | -25,954 | -28,806 | -31,003 | -32,779 |
| 2011 | -30,434 | -21,779 | -26,567 | -29,344 | -31,724 | -30,632 | -34,831 | -32,912 | -29,210 | -29,441 | -31,708 | -32,469 |
| 2012 | -30,779 | -28,179 | -30,434 | -32,958 | -33,778 | -36,166 | -39,671 | -37,538 | -40,115 | -35,192 | -33,686 | -36,661 |
| 2013 | -31,719 | -25,536 | -36,901 | -36,950 | -39,397 | -38,889 | -38,732 | -40,336 | -39,719 | -40,822 | -39,737 | -40,633 |
| 2014 | -37,069 | -32,274 | -38,059 | -37,015 | -37,918 | -39,030 | -39,046 | -38,347 | -32,611 | -35,234 | -39,795 | -36,114 |
| 2015 | -37,259 | -32,360 | -35,038 | -35,965 | -36,423 | -36,655 | -40,080 | -38,274 | -34,973 | -35,400 | -36,629 | -41,210 |
| 2016 | -36,823 | -35,364 | -40,309 | -39,413 | -40,774 | -38,524 | -39,762 | -39,558 | -36,908 | -35,950 | -39,308 | -41,299 |
| 2017 | -40,028 | -33,347 | -37,127 | -38,349 | -42,833 | -41,765 | -43,132 | -37,728 | -23,641 | -39,592 | -41,413 | -44,621 |
| 2018 | -41,782 | -37,207 | -41,058 | -40,101 | -39,591 | -38,205 | -39,985 | -44,352 | -42,632 | -41,763 | -40,791 | -44,572 |
| 2019 | -37,122 | -33,340 | -34,117 | -37,445 | -39,697 | -39,201 | -42,704 | -42,690 | -39,946 | -39,080 | -42,204 | -45,497 |
| 2020 | -42,757 | -35,404 | -35,471 | -29,625 | -35,588 | -36,144 | -39,798 | -34,122 | -36,368 | -43,765 | -41,405 | -41,354 |
| 2021 | -39,771 | -19,013 | -32,408 | -40,096 | -43,469 | -39,360 | -40,226 | -42,545 | -43,692 | -46,255 | -48,818 | -47,752 |
| 2022 | -44,280 | -36,220 | -46,999 | -43,534 | -43,055 | -45,471 | -47,276 | -45,337 | -45,088 | -46,694 | -47,787 | -44,307 |
| 2023 | -48,187 | -43,105 | -42,715 | -42,449 | -46,059 | -44,618 | -46,811 | -46,678 | -41,840 | -44,732 | -49,092 | -49,235 |
| 2024 | -42,038 | |||||||||||
| - = No Data Reported; -- = Not Applicable; NA = Not Available; W = Withheld to avoid disclosure of individual company data. |
| Release Date: 3/29/2024 |
| Next Release Date: 4/30/2024 |