|
Download Data (XLS File) |
|
||||||||
|
||||||||
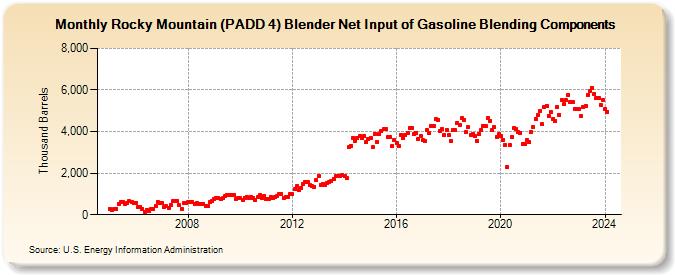
| Rocky Mountain (PADD 4) Blender Net Input of Gasoline Blending Components (Thousand Barrels) | ||||||||
| Year | Jan | Feb | Mar | Apr | May | Jun | Jul | Aug | Sep | Oct | Nov | Dec |
|---|---|---|---|---|---|---|---|---|---|---|---|---|
| 2005 | 295 | 244 | 289 | 293 | 538 | 609 | 609 | 497 | 559 | 636 | 624 | 541 |
| 2006 | 565 | 349 | 380 | 277 | 147 | 248 | 175 | 262 | 277 | 417 | 614 | 567 |
| 2007 | 554 | 368 | 403 | 327 | 444 | 637 | 650 | 675 | 447 | 285 | 558 | 581 |
| 2008 | 594 | 598 | 603 | 509 | 570 | 524 | 514 | 517 | 404 | 441 | 588 | 681 |
| 2009 | 752 | 793 | 804 | 779 | 788 | 885 | 931 | 939 | 942 | 963 | 749 | 810 |
| 2010 | 787 | 727 | 817 | 864 | 811 | 845 | 823 | 719 | 832 | 928 | 809 | 922 |
| 2011 | 770 | 778 | 873 | 790 | 839 | 902 | 1,003 | 1,005 | 821 | 836 | 856 | 1,000 |
| 2012 | 973 | 1,226 | 1,367 | 1,174 | 1,305 | 1,485 | 1,550 | 1,564 | 1,411 | 1,359 | 1,334 | 1,648 |
| 2013 | 1,859 | 1,451 | 1,482 | 1,432 | 1,541 | 1,588 | 1,628 | 1,737 | 1,843 | 1,852 | 1,860 | 1,896 |
| 2014 | 1,872 | 1,745 | 3,244 | 3,323 | 3,712 | 3,569 | 3,669 | 3,782 | 3,690 | 3,784 | 3,484 | 3,638 |
| 2015 | 3,707 | 3,240 | 3,879 | 3,516 | 3,871 | 4,010 | 4,106 | 4,133 | 3,739 | 3,745 | 3,306 | 3,579 |
| 2016 | 3,457 | 3,315 | 3,849 | 3,676 | 3,842 | 3,954 | 4,149 | 4,180 | 3,863 | 3,929 | 3,664 | 3,793 |
| 2017 | 3,570 | 3,539 | 4,082 | 3,910 | 4,263 | 4,283 | 4,586 | 4,566 | 4,040 | 4,114 | 3,831 | 4,063 |
| 2018 | 3,813 | 3,549 | 4,083 | 4,053 | 4,433 | 4,330 | 4,636 | 4,564 | 3,990 | 4,200 | 3,843 | 3,898 |
| 2019 | 3,771 | 3,566 | 3,892 | 4,051 | 4,273 | 4,247 | 4,642 | 4,531 | 4,094 | 4,197 | 3,742 | 3,866 |
| 2020 | 3,791 | 3,616 | 3,347 | 2,287 | 3,346 | 3,757 | 4,153 | 4,107 | 3,969 | 3,939 | 3,380 | 3,399 |
| 2021 | 3,600 | 3,497 | 3,979 | 4,242 | 4,606 | 4,791 | 4,999 | 4,351 | 5,159 | 5,250 | 4,753 | 4,952 |
| 2022 | 4,618 | 4,523 | 5,193 | 4,795 | 5,518 | 5,307 | 5,525 | 5,779 | 5,400 | 5,408 | 5,086 | 5,103 |
| 2023 | 5,085 | 4,730 | 5,174 | 5,236 | 5,780 | 5,950 | 6,105 | 5,807 | 5,618 | 5,607 | 5,295 | 5,519 |
| 2024 | 5,106 | |||||||||||
| - = No Data Reported; -- = Not Applicable; NA = Not Available; W = Withheld to avoid disclosure of individual company data. |
| Release Date: 3/29/2024 |
| Next Release Date: 4/30/2024 |