|
Download Data (XLS File) |
|
||||||||
|
||||||||
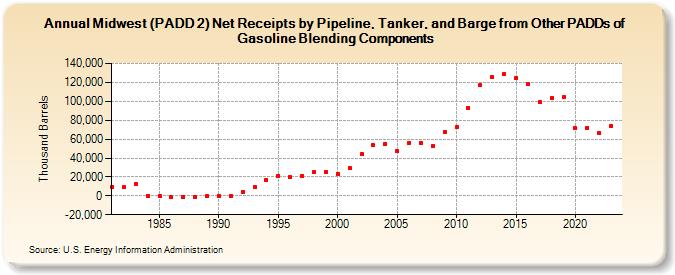
| Midwest (PADD 2) Net Receipts by Pipeline, Tanker, and Barge from Other PADDs of Gasoline Blending Components (Thousand Barrels) | ||||||||
| Decade | Year-0 | Year-1 | Year-2 | Year-3 | Year-4 | Year-5 | Year-6 | Year-7 | Year-8 | Year-9 |
|---|---|---|---|---|---|---|---|---|---|---|
| 1980's | 9,216 | 8,968 | 12,394 | 233 | -461 | -1,406 | -1,078 | -917 | -437 | |
| 1990's | 295 | 154 | 4,357 | 9,438 | 17,241 | 20,969 | 19,916 | 21,128 | 24,923 | 25,333 |
| 2000's | 23,560 | 29,284 | 44,173 | 53,356 | 54,771 | 47,196 | 55,925 | 56,175 | 52,529 | 67,313 |
| 2010's | 72,307 | 93,228 | 116,826 | 125,231 | 129,029 | 124,566 | 117,955 | 98,895 | 103,491 | 104,725 |
| 2020's | 71,245 | 71,928 | 66,298 | 74,204 |
| - = No Data Reported; -- = Not Applicable; NA = Not Available; W = Withheld to avoid disclosure of individual company data. |
| Release Date: 3/29/2024 |
| Next Release Date: 8/30/2024 |