|
Download Data (XLS File) |
|
||||||||
|
||||||||
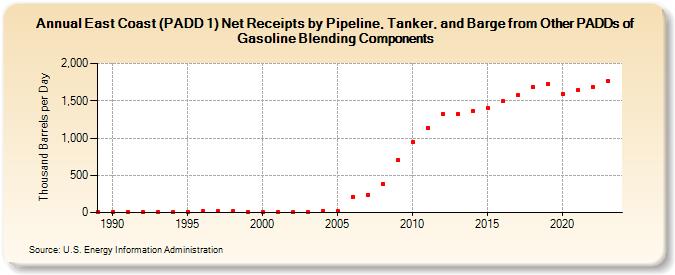
| East Coast (PADD 1) Net Receipts by Pipeline, Tanker, and Barge from Other PADDs of Gasoline Blending Components (Thousand Barrels per Day) | ||||||||
| Decade | Year-0 | Year-1 | Year-2 | Year-3 | Year-4 | Year-5 | Year-6 | Year-7 | Year-8 | Year-9 |
|---|---|---|---|---|---|---|---|---|---|---|
| 1980's | 8 | |||||||||
| 1990's | 8 | 12 | 6 | 5 | 7 | 8 | 17 | 15 | 17 | 11 |
| 2000's | 5 | 6 | 4 | 2 | 19 | 17 | 214 | 239 | 389 | 706 |
| 2010's | 945 | 1,140 | 1,320 | 1,325 | 1,364 | 1,399 | 1,492 | 1,571 | 1,683 | 1,726 |
| 2020's | 1,592 | 1,644 | 1,689 | 1,765 |
| - = No Data Reported; -- = Not Applicable; NA = Not Available; W = Withheld to avoid disclosure of individual company data. |
| Release Date: 3/29/2024 |
| Next Release Date: 8/30/2024 |