|
Download Data (XLS File) |
|
||||||||
|
||||||||
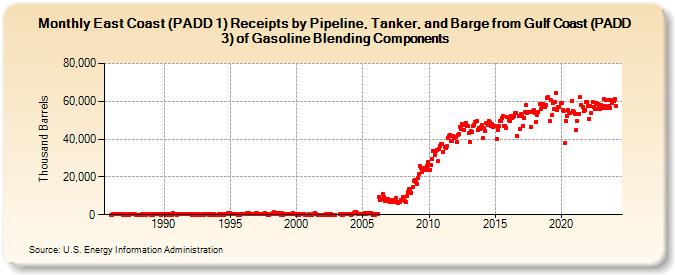
| East Coast (PADD 1) Receipts by Pipeline, Tanker, and Barge from Gulf Coast (PADD 3) of Gasoline Blending Components (Thousand Barrels) | ||||||||
| Year | Jan | Feb | Mar | Apr | May | Jun | Jul | Aug | Sep | Oct | Nov | Dec |
|---|---|---|---|---|---|---|---|---|---|---|---|---|
| 1986 | 92 | 66 | 179 | 280 | 124 | 148 | 145 | 376 | 277 | 440 | 252 | 23 |
| 1987 | 0 | 23 | 188 | 0 | 74 | 146 | 474 | 203 | 194 | 146 | 176 | 39 |
| 1988 | 19 | 105 | 109 | 38 | 163 | 63 | 114 | 53 | 0 | 181 | 166 | 136 |
| 1989 | 86 | 78 | 68 | 284 | 339 | 369 | 620 | 314 | 243 | 77 | 114 | 209 |
| 1990 | 135 | 190 | 73 | 365 | 240 | 0 | 171 | 0 | 771 | 185 | 199 | 171 |
| 1991 | 99 | 281 | 348 | 544 | 221 | 393 | 309 | 164 | 457 | 512 | 588 | 262 |
| 1992 | 163 | 0 | 53 | 258 | 249 | 61 | 86 | 77 | 154 | 0 | 0 | 133 |
| 1993 | 0 | 120 | 259 | 168 | 153 | 0 | 416 | 55 | 419 | 327 | 36 | 55 |
| 1994 | 39 | 19 | 366 | 43 | 185 | 43 | 38 | 133 | 397 | 383 | 686 | 680 |
| 1995 | 862 | 397 | 608 | 238 | 179 | 198 | 128 | 90 | 52 | 108 | 489 | 431 |
| 1996 | 390 | 473 | 571 | 869 | 632 | 666 | 375 | 487 | 222 | 496 | 633 | 682 |
| 1997 | 943 | 549 | 587 | 323 | 354 | 561 | 576 | 1,060 | 420 | 337 | 18 | 21 |
| 1998 | 381 | 332 | 433 | 826 | 1,176 | 191 | 644 | 627 | 267 | 763 | 20 | 688 |
| 1999 | 42 | 291 | 155 | 434 | 358 | 433 | 505 | 466 | 338 | 668 | 536 | 486 |
| 2000 | 25 | 176 | 95 | 380 | 217 | 185 | 465 | 484 | 101 | 35 | 20 | 277 |
| 2001 | 0 | 77 | 0 | 146 | 387 | 955 | 147 | 43 | 0 | 0 | 1 | 0 |
| 2002 | 0 | 0 | 0 | 182 | 517 | 0 | 238 | 163 | 0 | 0 | 0 | 0 |
| 2003 | 157 | 372 | 109 | 20 | 308 | 183 | ||||||
| 2004 | 444 | 17 | 249 | 613 | 1,072 | 1,271 | 1,263 | 1,118 | 545 | 493 | 327 | 605 |
| 2005 | 408 | 480 | 771 | 871 | 543 | 665 | 1,136 | 763 | 373 | 76 | 189 | 0 |
| 2006 | 216 | 414 | 273 | 9,266 | 8,022 | 8,095 | 11,123 | 9,598 | 7,296 | 8,517 | 7,292 | 8,294 |
| 2007 | 7,828 | 6,886 | 7,424 | 7,650 | 6,814 | 7,409 | 9,091 | 6,580 | 6,394 | 6,677 | 6,927 | 7,859 |
| 2008 | 9,143 | 7,980 | 7,032 | 6,744 | 9,845 | 11,782 | 13,687 | 13,549 | 11,611 | 14,556 | 17,707 | 18,520 |
| 2009 | 17,125 | 16,080 | 19,216 | 21,689 | 26,000 | 24,739 | 22,825 | 24,737 | 23,840 | 24,586 | 25,943 | 27,703 |
| 2010 | 23,611 | 23,838 | 26,263 | 29,513 | 33,748 | 31,736 | 33,644 | 34,089 | 28,171 | 34,757 | 36,579 | 37,614 |
| 2011 | 37,611 | 33,148 | 35,930 | 35,340 | 36,114 | 40,382 | 41,589 | 42,055 | 39,217 | 39,115 | 41,823 | 40,455 |
| 2012 | 41,206 | 38,323 | 42,329 | 42,917 | 46,649 | 45,272 | 47,729 | 47,211 | 44,729 | 48,594 | 46,707 | 46,944 |
| 2013 | 43,090 | 38,694 | 44,086 | 43,758 | 46,866 | 47,322 | 49,132 | 49,541 | 45,027 | 45,820 | 45,117 | 46,421 |
| 2014 | 47,235 | 40,580 | 45,709 | 44,460 | 48,304 | 47,589 | 49,585 | 49,019 | 46,897 | 47,728 | 46,477 | 46,757 |
| 2015 | 46,914 | 39,953 | 45,038 | 46,868 | 49,617 | 49,598 | 50,959 | 52,261 | 47,086 | 46,837 | 45,961 | 51,713 |
| 2016 | 50,253 | 49,422 | 52,175 | 50,932 | 51,763 | 52,186 | 53,926 | 53,781 | 41,558 | 52,230 | 45,250 | 53,201 |
| 2017 | 52,074 | 47,091 | 51,375 | 54,143 | 58,169 | 54,017 | 54,381 | 54,265 | 46,432 | 54,211 | 54,872 | 55,177 |
| 2018 | 53,859 | 49,058 | 52,908 | 54,448 | 58,464 | 56,114 | 57,599 | 58,442 | 58,215 | 56,849 | 58,087 | 61,575 |
| 2019 | 62,237 | 49,669 | 60,930 | 52,511 | 59,012 | 55,756 | 59,861 | 64,614 | 55,286 | 57,105 | 56,989 | 58,912 |
| 2020 | 59,068 | 55,308 | 54,742 | 37,745 | 49,327 | 52,141 | 55,413 | 53,687 | 53,639 | 60,404 | 55,010 | 54,161 |
| 2021 | 53,086 | 44,887 | 49,494 | 53,199 | 53,520 | 62,294 | 58,198 | 57,203 | 54,931 | 55,201 | 59,441 | 59,401 |
| 2022 | 57,583 | 50,739 | 57,469 | 53,736 | 59,592 | 56,985 | 56,113 | 59,168 | 56,005 | 58,795 | 56,231 | 56,072 |
| 2023 | 57,948 | 56,553 | 61,031 | 57,556 | 60,560 | 56,284 | 60,750 | 57,550 | 56,510 | 60,438 | 59,179 | 60,002 |
| 2024 | 61,161 | 57,420 | 59,903 | 57,348 | 60,888 | 55,857 | ||||||
| - = No Data Reported; -- = Not Applicable; NA = Not Available; W = Withheld to avoid disclosure of individual company data. |
| Release Date: 8/30/2024 |
| Next Release Date: 9/30/2024 |