|
Download Data (XLS File) |
|
||||||||
|
||||||||
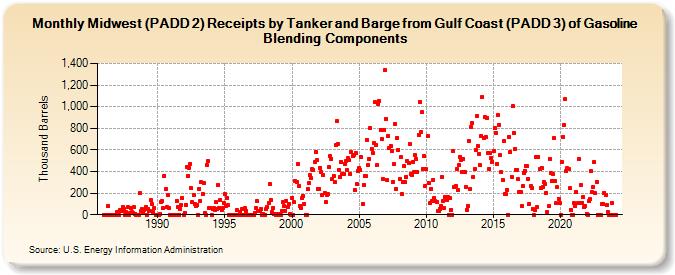
| Midwest (PADD 2) Receipts by Tanker and Barge from Gulf Coast (PADD 3) of Gasoline Blending Components (Thousand Barrels) | ||||||||
| Year | Jan | Feb | Mar | Apr | May | Jun | Jul | Aug | Sep | Oct | Nov | Dec |
|---|---|---|---|---|---|---|---|---|---|---|---|---|
| 1986 | 0 | 0 | 0 | 0 | 84 | 0 | 0 | 0 | 0 | 0 | 0 | 0 |
| 1987 | 25 | 0 | 42 | 33 | 33 | 76 | 57 | 0 | 24 | 67 | 0 | 15 |
| 1988 | 62 | 22 | 15 | 67 | 9 | 0 | 0 | 0 | 199 | 37 | 52 | 25 |
| 1989 | 45 | 71 | 0 | 54 | 36 | 30 | 136 | 99 | 29 | 58 | 0 | 0 |
| 1990 | 0 | 0 | 10 | 120 | 129 | 60 | 363 | 237 | 68 | 180 | 60 | 0 |
| 1991 | 0 | 0 | 0 | 0 | 0 | 131 | 73 | 0 | 57 | 89 | 155 | 0 |
| 1992 | 20 | 90 | 444 | 361 | 436 | 474 | 247 | 115 | 183 | 101 | 83 | 90 |
| 1993 | 0 | 242 | 127 | 299 | 189 | 292 | 20 | 0 | 458 | 498 | 65 | 62 |
| 1994 | 0 | 50 | 61 | 47 | 117 | 57 | 275 | 66 | 137 | 45 | 59 | 113 |
| 1995 | 190 | 85 | 158 | 86 | 0 | 0 | 0 | 0 | 0 | 0 | 0 | 40 |
| 1996 | 0 | 25 | 0 | 49 | 0 | 0 | 58 | 38 | 0 | 0 | 0 | 0 |
| 1997 | 0 | 0 | 0 | 20 | 61 | 126 | 38 | 38 | 57 | 0 | 10 | 0 |
| 1998 | 0 | 50 | 70 | 104 | 282 | 138 | 26 | 66 | 5 | 10 | 0 | 8 |
| 1999 | 0 | 11 | 0 | 32 | 119 | 78 | 36 | 130 | 75 | 100 | 5 | 0 |
| 2000 | 158 | 0 | 115 | 310 | 300 | 468 | 268 | 85 | 61 | 151 | 173 | 97 |
| 2001 | 0 | 0 | 238 | 289 | 364 | 339 | 419 | 417 | 488 | 582 | 503 | 237 |
| 2002 | 241 | 437 | 399 | 185 | 366 | 202 | 117 | 185 | 190 | 439 | 542 | 519 |
| 2003 | 329 | 359 | 304 | 641 | 863 | 655 | 416 | 350 | 492 | 374 | 379 | 474 |
| 2004 | 495 | 413 | 522 | 504 | 376 | 576 | 541 | 550 | 227 | 569 | 283 | 403 |
| 2005 | 437 | 414 | 533 | 101 | 278 | 358 | 360 | 692 | 457 | 516 | 800 | 611 |
| 2006 | 568 | 664 | 1,043 | 647 | 460 | 1,027 | 1,057 | 782 | 698 | 333 | 784 | 1,338 |
| 2007 | 890 | 318 | 733 | 616 | 638 | 587 | 303 | 467 | 842 | 241 | 714 | 601 |
| 2008 | 328 | 533 | 194 | 306 | 452 | 300 | 352 | 493 | 482 | 659 | 379 | 371 |
| 2009 | 491 | 397 | 550 | 517 | 395 | 736 | 1,047 | 764 | 949 | 424 | 544 | 265 |
| 2010 | 419 | 728 | 294 | 104 | 241 | 130 | 325 | 157 | 127 | 122 | 35 | 35 |
| 2011 | 56 | 84 | 352 | 130 | 60 | 162 | 140 | 165 | 0 | 154 | 46 | 0 |
| 2012 | 592 | 254 | 268 | 424 | 228 | 458 | 537 | 508 | 398 | 517 | 400 | 259 |
| 2013 | 47 | 80 | 684 | 240 | 812 | 849 | 347 | 419 | 597 | 916 | 634 | 563 |
| 2014 | 456 | 726 | 1,090 | 708 | 902 | 718 | 893 | 571 | 426 | 570 | 528 | 490 |
| 2015 | 592 | 806 | 758 | 474 | 923 | 833 | 551 | 391 | 322 | 679 | 191 | 188 |
| 2016 | 229 | 0 | 721 | 581 | 352 | 1,002 | 761 | 608 | 418 | 415 | 328 | 211 |
| 2017 | 212 | 81 | 266 | 387 | 407 | 450 | 450 | 333 | 103 | 262 | 250 | 51 |
| 2018 | 0 | 48 | 534 | 72 | 532 | 421 | 243 | 437 | 258 | 305 | 286 | 205 |
| 2019 | 27 | 77 | 520 | 385 | 313 | 381 | 709 | 312 | 105 | 253 | 149 | 104 |
| 2020 | 0 | 490 | 719 | 835 | 1,067 | 405 | 428 | 424 | 243 | 48 | 0 | 0 |
| 2021 | 106 | 81 | 210 | 106 | 518 | 105 | 273 | 109 | 161 | 70 | 82 | 7 |
| 2022 | 0 | 126 | 142 | 402 | 206 | 257 | 492 | 198 | 305 | 0 | 0 | 0 |
| 2023 | 0 | 101 | 100 | 205 | 178 | 86 | 27 | 0 | 0 | 0 | 108 | 0 |
| 2024 | 0 | |||||||||||
| - = No Data Reported; -- = Not Applicable; NA = Not Available; W = Withheld to avoid disclosure of individual company data. |
| Release Date: 3/29/2024 |
| Next Release Date: 4/30/2024 |