|
Download Data (XLS File) |
|
||||||||
|
||||||||
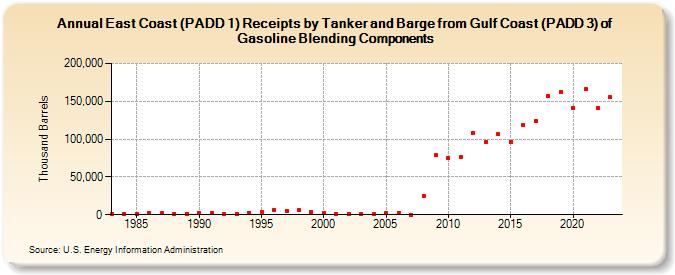
| East Coast (PADD 1) Receipts by Tanker and Barge from Gulf Coast (PADD 3) of Gasoline Blending Components (Thousand Barrels) | ||||||||
| Decade | Year-0 | Year-1 | Year-2 | Year-3 | Year-4 | Year-5 | Year-6 | Year-7 | Year-8 | Year-9 |
|---|---|---|---|---|---|---|---|---|---|---|
| 1980's | 541 | 1,304 | 1,124 | 2,402 | 1,663 | 1,147 | 851 | |||
| 1990's | 1,759 | 1,752 | 744 | 601 | 2,473 | 3,509 | 6,413 | 5,418 | 6,206 | 3,912 |
| 2000's | 2,095 | 1,282 | 803 | 1,047 | 1,266 | 2,808 | 2,274 | 249 | 25,324 | 78,335 |
| 2010's | 75,434 | 75,906 | 107,437 | 96,812 | 106,100 | 96,777 | 118,304 | 123,529 | 157,030 | 161,928 |
| 2020's | 141,751 | 165,805 | 140,584 | 155,102 |
| - = No Data Reported; -- = Not Applicable; NA = Not Available; W = Withheld to avoid disclosure of individual company data. |
| Release Date: 3/29/2024 |
| Next Release Date: 8/30/2024 |