|
Download Data (XLS File) |
|
||||||||
|
||||||||
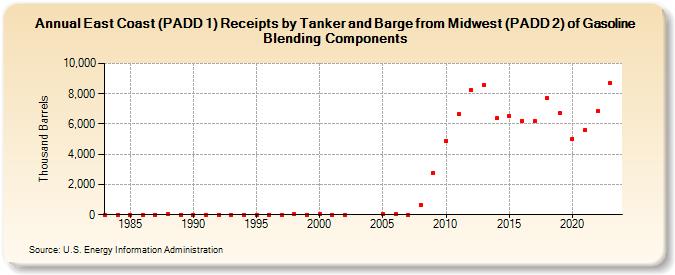
| East Coast (PADD 1) Receipts by Tanker and Barge from Midwest (PADD 2) of Gasoline Blending Components (Thousand Barrels) | ||||||||
| Decade | Year-0 | Year-1 | Year-2 | Year-3 | Year-4 | Year-5 | Year-6 | Year-7 | Year-8 | Year-9 |
|---|---|---|---|---|---|---|---|---|---|---|
| 1980's | 0 | 0 | 0 | 0 | 0 | 20 | 0 | |||
| 1990's | 0 | 0 | 0 | 0 | 0 | 0 | 0 | 0 | 44 | 0 |
| 2000's | 36 | 12 | 0 | 24 | 26 | 0 | 668 | 2,773 | ||
| 2010's | 4,901 | 6,627 | 8,261 | 8,591 | 6,373 | 6,530 | 6,221 | 6,193 | 7,701 | 6,722 |
| 2020's | 5,039 | 5,589 | 6,872 | 8,729 |
| - = No Data Reported; -- = Not Applicable; NA = Not Available; W = Withheld to avoid disclosure of individual company data. |
| Release Date: 8/30/2024 |
| Next Release Date: 8/29/2025 |