|
Download Data (XLS File) |
|
||||||||
|
||||||||
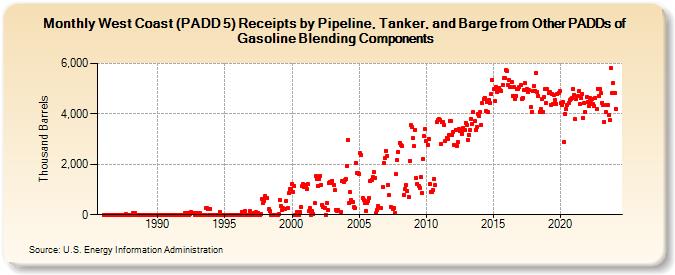
| West Coast (PADD 5) Receipts by Pipeline, Tanker, and Barge from Other PADDs of Gasoline Blending Components (Thousand Barrels) | ||||||||
| Year | Jan | Feb | Mar | Apr | May | Jun | Jul | Aug | Sep | Oct | Nov | Dec |
|---|---|---|---|---|---|---|---|---|---|---|---|---|
| 1986 | 0 | 0 | 0 | 0 | 0 | 0 | 0 | 0 | 0 | 0 | 0 | 0 |
| 1987 | 0 | 0 | 0 | 0 | 0 | 0 | 0 | 0 | 22 | 0 | 0 | 0 |
| 1988 | 0 | 0 | 64 | 0 | 60 | 0 | 0 | 0 | 0 | 0 | 0 | 0 |
| 1989 | 0 | 0 | 0 | 0 | 0 | 0 | 0 | 0 | 0 | 0 | 0 | 0 |
| 1990 | 0 | 0 | 0 | 0 | 0 | 0 | 0 | 0 | 0 | 0 | 0 | 0 |
| 1991 | 0 | 0 | 0 | 0 | 0 | 0 | 0 | 0 | 0 | 0 | 0 | 0 |
| 1992 | 50 | 0 | 33 | 70 | 0 | 25 | 100 | 68 | 70 | 0 | 0 | 58 |
| 1993 | 0 | 42 | 51 | 0 | 0 | 0 | 0 | 250 | 250 | 218 | 0 | 238 |
| 1994 | 0 | 0 | 0 | 0 | 0 | 0 | 0 | 0 | 103 | 0 | 0 | 0 |
| 1995 | 0 | 0 | 0 | 0 | 0 | 0 | 0 | 0 | 0 | 0 | 0 | 0 |
| 1996 | 0 | 0 | 0 | 116 | 0 | 89 | 157 | 0 | 0 | 0 | 146 | 0 |
| 1997 | 0 | 0 | 58 | 0 | 102 | 0 | 59 | 0 | 19 | 611 | 450 | 545 |
| 1998 | 734 | 678 | 646 | 217 | 146 | 0 | 0 | 0 | 0 | 0 | 0 | 0 |
| 1999 | 46 | 600 | 327 | 187 | 256 | 225 | 230 | 556 | 254 | 850 | 1,013 | 1,011 |
| 2000 | 1,229 | 894 | 1,136 | 0 | 107 | 0 | 0 | 100 | 298 | 1,120 | 1,203 | 1,119 |
| 2001 | 1,171 | 1,001 | 1,231 | 128 | 264 | 0 | 141 | 47 | 459 | 1,519 | 1,422 | 1,148 |
| 2002 | 1,430 | 1,530 | 1,177 | 399 | 291 | 273 | 0 | 469 | 183 | 1,249 | 1,288 | 1,260 |
| 2003 | 1,349 | 1,194 | 965 | 200 | 160 | 171 | 121 | 1,349 | 1,283 | 1,358 | ||
| 2004 | 1,412 | 1,936 | 2,982 | 453 | 883 | 578 | 495 | 287 | 256 | 2,060 | 1,666 | 1,640 |
| 2005 | 1,632 | 2,442 | 2,376 | 655 | 603 | 464 | 156 | 455 | 532 | 654 | 1,341 | 1,368 |
| 2006 | 1,481 | 1,694 | 1,468 | 58 | 195 | 347 | 275 | 1,105 | 2,035 | 2,248 | ||
| 2007 | 2,546 | 2,338 | 1,195 | 781 | 316 | 246 | 254 | 75 | 1,598 | 2,164 | 2,494 | |
| 2008 | 2,860 | 2,748 | 2,731 | 780 | 1,023 | 1,162 | 937 | 707 | 2,150 | 3,545 | 3,484 | |
| 2009 | 3,028 | 2,716 | 3,372 | 1,465 | 1,232 | 1,153 | 1,066 | 1,481 | 874 | 2,212 | 3,109 | 3,393 |
| 2010 | 2,929 | 2,761 | 3,014 | 1,221 | 905 | 900 | 976 | 1,429 | 1,178 | 3,675 | 3,740 | 3,797 |
| 2011 | 3,760 | 2,819 | 3,671 | 3,676 | 3,555 | 2,922 | 3,056 | 3,001 | 3,171 | 3,710 | 3,726 | 3,145 |
| 2012 | 3,284 | 2,779 | 3,361 | 2,720 | 2,880 | 3,398 | 3,336 | 3,320 | 3,222 | 3,451 | 3,369 | 3,649 |
| 2013 | 3,575 | 2,981 | 3,181 | 3,368 | 3,804 | 3,616 | 4,066 | 3,706 | 3,371 | 3,473 | 4,014 | 3,921 |
| 2014 | 4,067 | 3,572 | 4,419 | 4,577 | 4,649 | 4,095 | 4,489 | 4,073 | 4,543 | 4,437 | 4,798 | 5,341 |
| 2015 | 4,971 | 4,502 | 5,051 | 4,880 | 5,037 | 5,041 | 4,938 | 4,921 | 5,159 | 5,406 | 5,419 | 5,736 |
| 2016 | 5,721 | 5,158 | 5,353 | 5,069 | 5,285 | 4,721 | 5,086 | 4,580 | 4,716 | 4,973 | 4,969 | 5,052 |
| 2017 | 5,144 | 4,606 | 4,644 | 4,941 | 5,229 | 4,953 | 5,005 | 4,860 | 4,931 | 4,262 | 4,085 | 4,896 |
| 2018 | 5,123 | 4,919 | 5,635 | 4,859 | 4,695 | 4,086 | 4,198 | 4,574 | 4,087 | 4,673 | 4,990 | 4,440 |
| 2019 | 4,984 | 4,826 | 4,866 | 4,361 | 4,794 | 4,390 | 4,735 | 4,561 | 4,405 | 4,806 | 4,838 | 4,910 |
| 2020 | 4,430 | 4,360 | 4,484 | 2,899 | 4,009 | 4,186 | 4,361 | 4,435 | 4,541 | 4,610 | 4,611 | 4,973 |
| 2021 | 4,765 | 3,787 | 4,608 | 4,696 | 4,898 | 4,380 | 4,644 | 4,792 | 3,838 | 4,417 | 4,089 | 4,661 |
| 2022 | 4,491 | 4,321 | 4,611 | 4,443 | 4,596 | 4,377 | 4,316 | 4,638 | 4,184 | 4,998 | 4,709 | 4,999 |
| 2023 | 4,810 | 4,451 | 4,346 | 3,694 | 4,073 | 4,371 | 4,353 | 3,969 | 3,757 | 5,821 | 4,830 | 5,233 |
| 2024 | 4,811 | |||||||||||
| - = No Data Reported; -- = Not Applicable; NA = Not Available; W = Withheld to avoid disclosure of individual company data. |
| Release Date: 3/29/2024 |
| Next Release Date: 4/30/2024 |
Referring Pages: