|
Download Data (XLS File) |
|
||||||||
|
||||||||
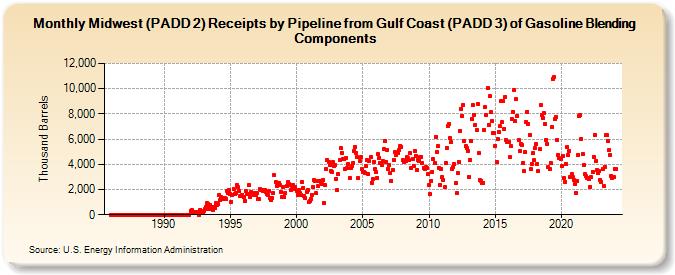
| Midwest (PADD 2) Receipts by Pipeline from Gulf Coast (PADD 3) of Gasoline Blending Components (Thousand Barrels) | ||||||||
| Year | Jan | Feb | Mar | Apr | May | Jun | Jul | Aug | Sep | Oct | Nov | Dec |
|---|---|---|---|---|---|---|---|---|---|---|---|---|
| 1986 | 0 | 0 | 0 | 0 | 0 | 0 | 0 | 0 | 0 | 0 | 0 | 0 |
| 1987 | 0 | 0 | 0 | 0 | 0 | 0 | 0 | 0 | 0 | 0 | 0 | 0 |
| 1988 | 0 | 0 | 0 | 0 | 0 | 0 | 0 | 0 | 0 | 0 | 0 | 0 |
| 1989 | 0 | 0 | 0 | 0 | 0 | 0 | 0 | 0 | 0 | 0 | 0 | 0 |
| 1990 | 0 | 0 | 0 | 0 | 0 | 0 | 0 | 0 | 0 | 0 | 0 | 0 |
| 1991 | 0 | 0 | 0 | 0 | 0 | 0 | 0 | 0 | 0 | 0 | 0 | 0 |
| 1992 | 310 | 354 | 177 | 114 | 110 | 225 | 175 | 110 | 0 | 411 | 121 | 134 |
| 1993 | 298 | 422 | 620 | 929 | 878 | 443 | 779 | 602 | 411 | 608 | 551 | 900 |
| 1994 | 789 | 840 | 1,547 | 1,164 | 1,378 | 1,257 | 1,332 | 1,290 | 1,268 | 1,897 | 1,737 | 1,955 |
| 1995 | 1,683 | 1,044 | 1,598 | 2,021 | 1,669 | 1,715 | 2,341 | 2,169 | 1,852 | 1,466 | 1,455 | 1,603 |
| 1996 | 1,444 | 1,122 | 1,919 | 1,604 | 1,648 | 2,339 | 1,384 | 1,829 | 1,726 | 1,593 | 1,749 | 1,538 |
| 1997 | 1,738 | 1,220 | 1,216 | 2,001 | 1,961 | 1,949 | 1,871 | 1,996 | 1,802 | 1,651 | 1,595 | 1,861 |
| 1998 | 1,310 | 1,161 | 1,344 | 1,722 | 3,120 | 2,567 | 2,316 | 2,427 | 2,552 | 2,330 | 1,830 | 1,413 |
| 1999 | 2,215 | 1,442 | 1,722 | 2,271 | 2,570 | 2,453 | 2,359 | 2,000 | 2,059 | 2,357 | 2,075 | 2,210 |
| 2000 | 1,909 | 1,587 | 1,962 | 1,703 | 1,559 | 2,610 | 2,136 | 1,453 | 1,335 | 1,842 | 1,999 | 979 |
| 2001 | 1,085 | 1,264 | 1,584 | 2,218 | 2,773 | 2,697 | 1,696 | 2,275 | 2,687 | 2,682 | 2,604 | 2,434 |
| 2002 | 2,756 | 966 | 2,350 | 3,627 | 4,322 | 4,217 | 3,964 | 3,469 | 3,377 | 4,171 | 3,875 | 3,940 |
| 2003 | 2,866 | 1,968 | 3,197 | 4,317 | 5,274 | 4,906 | 4,445 | 4,411 | 3,644 | 4,534 | 3,685 | 4,054 |
| 2004 | 2,950 | 3,690 | 3,842 | 4,086 | 5,073 | 5,360 | 4,923 | 4,576 | 2,902 | 4,293 | 4,567 | 3,592 |
| 2005 | 3,378 | 3,403 | 3,345 | 3,863 | 4,316 | 3,226 | 4,241 | 4,581 | 2,545 | 2,802 | 4,214 | 3,596 |
| 2006 | 3,352 | 2,923 | 4,828 | 4,538 | 4,078 | 3,963 | 4,281 | 5,228 | 5,862 | 4,214 | 5,166 | 3,650 |
| 2007 | 3,967 | 3,336 | 2,694 | 3,532 | 4,347 | 4,987 | 4,725 | 4,900 | 4,858 | 5,129 | 5,477 | 5,374 |
| 2008 | 4,317 | 4,218 | 4,273 | 4,233 | 4,572 | 4,480 | 4,346 | 4,890 | 3,681 | 4,416 | 3,831 | 5,078 |
| 2009 | 4,687 | 3,586 | 4,376 | 4,301 | 4,587 | 4,590 | 4,110 | 3,736 | 3,614 | 3,749 | 3,669 | 3,208 |
| 2010 | 2,350 | 1,634 | 2,706 | 3,427 | 4,413 | 4,137 | 6,195 | 4,946 | 5,414 | 3,735 | 2,352 | 3,659 |
| 2011 | 2,953 | 2,773 | 2,164 | 4,136 | 5,316 | 7,036 | 7,160 | 6,085 | 5,755 | 3,625 | 3,782 | 4,008 |
| 2012 | 2,485 | 1,700 | 3,307 | 4,184 | 6,663 | 8,409 | 7,870 | 8,728 | 5,827 | 5,442 | 5,300 | 5,083 |
| 2013 | 3,012 | 4,348 | 5,841 | 7,578 | 8,699 | 7,924 | 7,145 | 6,714 | 8,791 | 4,900 | 2,737 | 2,695 |
| 2014 | 2,501 | 2,549 | 6,755 | 8,527 | 7,907 | 10,031 | 7,151 | 9,391 | 8,123 | 7,407 | 6,510 | 6,476 |
| 2015 | 5,481 | 4,154 | 6,006 | 6,586 | 7,005 | 8,984 | 7,340 | 9,006 | 6,808 | 9,367 | 5,913 | 5,755 |
| 2016 | 5,748 | 4,558 | 5,414 | 7,617 | 8,184 | 9,896 | 7,437 | 9,144 | 7,834 | 5,917 | 5,044 | 5,643 |
| 2017 | 5,527 | 4,105 | 3,446 | 4,960 | 7,370 | 8,177 | 7,203 | 6,334 | 3,598 | 4,009 | 4,891 | 4,321 |
| 2018 | 5,286 | 5,620 | 4,030 | 3,462 | 5,186 | 8,702 | 7,945 | 7,707 | 8,049 | 7,211 | 5,965 | 5,629 |
| 2019 | 3,766 | 3,612 | 4,117 | 6,941 | 10,805 | 10,926 | 7,608 | 7,756 | 5,943 | 4,756 | 4,464 | 4,456 |
| 2020 | 3,838 | 4,693 | 2,883 | 2,635 | 4,055 | 5,361 | 4,772 | 5,054 | 2,983 | 3,248 | 2,974 | 2,789 |
| 2021 | 2,446 | 1,712 | 2,665 | 4,762 | 7,856 | 7,895 | 6,039 | 4,799 | 3,916 | 3,199 | 3,058 | 2,909 |
| 2022 | 2,922 | 2,807 | 2,210 | 2,962 | 3,398 | 4,619 | 6,354 | 4,270 | 3,556 | 3,281 | 3,482 | 2,763 |
| 2023 | 2,627 | 3,637 | 2,308 | 3,809 | 6,301 | 6,286 | 5,821 | 5,123 | 4,768 | 3,091 | 2,936 | 2,961 |
| 2024 | 3,661 | |||||||||||
| - = No Data Reported; -- = Not Applicable; NA = Not Available; W = Withheld to avoid disclosure of individual company data. |
| Release Date: 3/29/2024 |
| Next Release Date: 4/30/2024 |