|
Download Data (XLS File) |
|
||||||||
|
||||||||
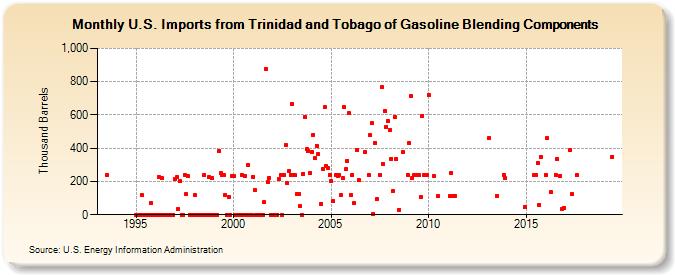
| U.S. Imports from Trinidad and Tobago of Gasoline Blending Components (Thousand Barrels) | ||||||||
| Year | Jan | Feb | Mar | Apr | May | Jun | Jul | Aug | Sep | Oct | Nov | Dec |
|---|---|---|---|---|---|---|---|---|---|---|---|---|
| 1993 | 238 | |||||||||||
| 1995 | 0 | 0 | 0 | 0 | 116 | 0 | 0 | 0 | 0 | 68 | 0 | 0 |
| 1996 | 0 | 0 | 229 | 0 | 219 | 0 | 0 | 0 | 0 | 0 | 0 | 0 |
| 1997 | 217 | 225 | 35 | 200 | 0 | 0 | 240 | 123 | 231 | 0 | 0 | 0 |
| 1998 | 119 | 0 | 0 | 0 | 0 | 0 | 240 | 0 | 0 | 229 | 0 | 220 |
| 1999 | 0 | 0 | 0 | 382 | 249 | 239 | 240 | 120 | 0 | 109 | 0 | 233 |
| 2000 | 230 | 0 | 0 | 0 | 0 | 239 | 0 | 235 | 0 | 299 | 0 | 0 |
| 2001 | 229 | 150 | 0 | 0 | 0 | 0 | 0 | 75 | 877 | 198 | 221 | 0 |
| 2002 | 0 | 0 | 0 | 0 | 214 | 240 | 0 | 239 | 420 | 188 | 264 | 240 |
| 2003 | 668 | 239 | 237 | 125 | 125 | 50 | 0 | 247 | 586 | 395 | 384 | 252 |
| 2004 | 378 | 482 | 343 | 416 | 366 | 67 | 276 | 646 | 294 | 281 | 240 | |
| 2005 | 200 | 80 | 239 | 233 | 239 | 119 | 220 | 645 | 272 | 325 | 610 | |
| 2006 | 120 | 239 | 70 | 391 | 206 | 377 | 239 | |||||
| 2007 | 477 | 549 | 5 | 434 | 93 | 241 | 768 | 307 | 624 | 530 | 563 | |
| 2008 | 510 | 337 | 142 | 588 | 336 | 30 | 375 | 240 | ||||
| 2009 | 430 | 712 | 222 | 240 | 240 | 239 | 105 | 595 | 238 | 240 | ||
| 2010 | 720 | 234 | 110 | |||||||||
| 2011 | 110 | 251 | 111 | 115 | ||||||||
| 2013 | 461 | 115 | 241 | 219 | ||||||||
| 2014 | 49 | |||||||||||
| 2015 | 240 | 240 | 312 | 60 | 349 | |||||||
| 2016 | 239 | 459 | 134 | 240 | 335 | 233 | 35 | 43 | ||||
| 2017 | 387 | 123 | 240 | |||||||||
| 2019 | 350 | |||||||||||
| - = No Data Reported; -- = Not Applicable; NA = Not Available; W = Withheld to avoid disclosure of individual company data. |
| Release Date: 3/29/2024 |
| Next Release Date: 4/30/2024 |