|
Download Data (XLS File) |
|
||||||||
|
||||||||
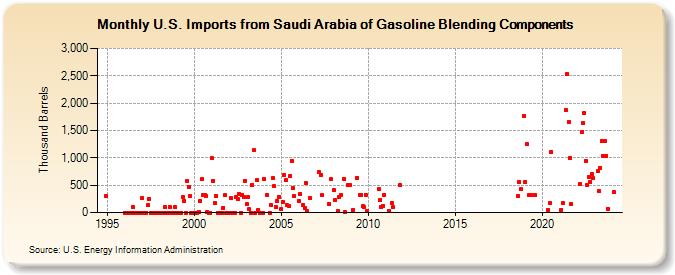
| U.S. Imports from Saudi Arabia of Gasoline Blending Components (Thousand Barrels) | ||||||||
| Year | Jan | Feb | Mar | Apr | May | Jun | Jul | Aug | Sep | Oct | Nov | Dec |
|---|---|---|---|---|---|---|---|---|---|---|---|---|
| 1994 | 308 | |||||||||||
| 1996 | 0 | 0 | 0 | 0 | 0 | 0 | 93 | 0 | 0 | 0 | 0 | 0 |
| 1997 | 266 | 0 | 0 | 0 | 147 | 247 | 0 | 0 | 0 | 0 | 0 | 0 |
| 1998 | 0 | 0 | 0 | 0 | 100 | 0 | 0 | 106 | 0 | 0 | 0 | 97 |
| 1999 | 0 | 0 | 0 | 1 | 280 | 219 | 0 | 573 | 472 | 305 | 0 | 0 |
| 2000 | 1 | 0 | 0 | 18 | 218 | 609 | 312 | 313 | 306 | 8 | 0 | 0 |
| 2001 | 988 | 585 | 179 | 308 | 0 | 0 | 0 | 0 | 88 | 312 | 0 | 0 |
| 2002 | 0 | 263 | 0 | 0 | 0 | 286 | 247 | 341 | 0 | 327 | 282 | 584 |
| 2003 | 150 | 276 | 60 | 0 | 505 | 1,138 | 0 | 594 | 46 | 0 | 0 | 0 |
| 2004 | 618 | 326 | 1 | 130 | 628 | 477 | 100 | 210 | 288 | |||
| 2005 | 64 | 185 | 685 | 589 | 130 | 122 | 671 | 951 | 445 | 294 | ||
| 2006 | 215 | 339 | 145 | 78 | 535 | 23 | 262 | |||||
| 2007 | 733 | 683 | 320 | 159 | 612 | |||||||
| 2008 | 413 | 226 | 33 | 283 | 318 | 618 | 12 | 505 | 496 | |||
| 2009 | 50 | 639 | 319 | 326 | 112 | 95 | 330 | 20 | ||||
| 2010 | 433 | 230 | 100 | 129 | 321 | |||||||
| 2011 | 37 | 176 | 95 | 501 | ||||||||
| 2018 | 305 | 559 | 425 | 1,769 | ||||||||
| 2019 | 558 | 1,251 | 321 | 319 | 324 | |||||||
| 2020 | 52 | 183 | 1,110 | |||||||||
| 2021 | 50 | 176 | 1,874 | 2,536 | 1,659 | 994 | 158 | |||||
| 2022 | 518 | 1,467 | 1,636 | 1,818 | 946 | 502 | 645 | 556 | 707 | 623 | ||
| 2023 | 751 | 387 | 813 | 1,309 | 1,030 | 1,309 | 1,034 | 73 | ||||
| - = No Data Reported; -- = Not Applicable; NA = Not Available; W = Withheld to avoid disclosure of individual company data. |
| Release Date: 3/29/2024 |
| Next Release Date: 4/30/2024 |