|
Download Data (XLS File) |
|
||||||||
|
||||||||
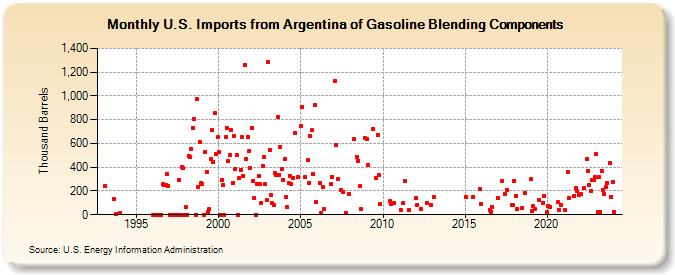
| U.S. Imports from Argentina of Gasoline Blending Components (Thousand Barrels) | ||||||||
| Year | Jan | Feb | Mar | Apr | May | Jun | Jul | Aug | Sep | Oct | Nov | Dec |
|---|---|---|---|---|---|---|---|---|---|---|---|---|
| 1993 | 241 | 129 | 3 | |||||||||
| 1994 | 11 | |||||||||||
| 1996 | 0 | 0 | 0 | 0 | 0 | 0 | 0 | 255 | 252 | 249 | 343 | 244 |
| 1997 | 0 | 0 | 0 | 0 | 0 | 0 | 0 | 294 | 0 | 401 | 393 | 0 |
| 1998 | 63 | 0 | 494 | 483 | 549 | 734 | 807 | 0 | 974 | 235 | 608 | 268 |
| 1999 | 255 | 0 | 532 | 357 | 27 | 50 | 467 | 711 | 444 | 854 | 515 | 650 |
| 2000 | 525 | 0 | 295 | 249 | 0 | 656 | 731 | 452 | 502 | 710 | 270 | 663 |
| 2001 | 388 | 505 | 0 | 307 | 373 | 653 | 330 | 1,263 | 470 | 656 | 533 | 397 |
| 2002 | 731 | 282 | 139 | 0 | 262 | 325 | 257 | 100 | 412 | 485 | 255 | 121 |
| 2003 | 1,285 | 545 | 166 | 96 | 85 | 353 | 337 | 824 | 331 | 571 | 386 | 292 |
| 2004 | 468 | 146 | 62 | 267 | 326 | 260 | 313 | 687 | 317 | |||
| 2005 | 749 | 907 | 317 | 458 | 271 | 662 | 709 | 344 | 920 | 106 | ||
| 2006 | 265 | 12 | 230 | 50 | 256 | 320 | ||||||
| 2007 | 1,128 | 583 | 298 | 206 | 189 | 12 | 171 | |||||
| 2008 | 634 | 488 | 455 | 240 | 45 | 642 | ||||||
| 2009 | 634 | 418 | 722 | 313 | 673 | 334 | 94 | |||||
| 2010 | 112 | 86 | 96 | |||||||||
| 2011 | 40 | 100 | 282 | 43 | ||||||||
| 2012 | 138 | 84 | 49 | 98 | 82 | |||||||
| 2013 | 146 | |||||||||||
| 2015 | 147 | 150 | 220 | |||||||||
| 2016 | 90 | 38 | 25 | 66 | ||||||||
| 2017 | 142 | 284 | 178 | 206 | 80 | 81 | ||||||
| 2018 | 287 | 156 | 48 | 58 | 182 | |||||||
| 2019 | 299 | 29 | 71 | 52 | 128 | 101 | 160 | |||||
| 2020 | 26 | 76 | 65 | 107 | 38 | 79 | ||||||
| 2021 | 37 | 359 | 140 | 160 | 225 | 200 | 162 | |||||
| 2022 | 171 | 222 | 469 | 372 | 247 | 203 | 293 | 292 | 315 | |||
| 2023 | 507 | 21 | 317 | 21 | 372 | 212 | 176 | 232 | 267 | 434 | 151 | |
| 2024 | 278 | |||||||||||
| - = No Data Reported; -- = Not Applicable; NA = Not Available; W = Withheld to avoid disclosure of individual company data. |
| Release Date: 3/29/2024 |
| Next Release Date: 4/30/2024 |