|
Download Data (XLS File) |
|
||||||||
|
||||||||
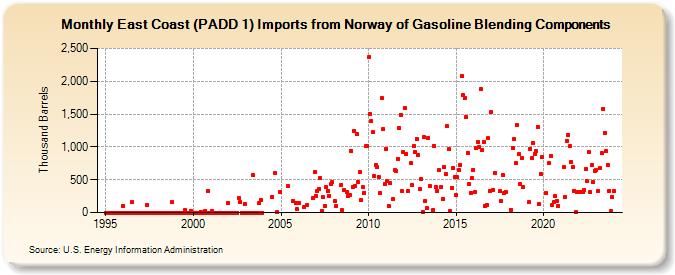
| East Coast (PADD 1) Imports from Norway of Gasoline Blending Components (Thousand Barrels) | ||||||||
| Year | Jan | Feb | Mar | Apr | May | Jun | Jul | Aug | Sep | Oct | Nov | Dec |
|---|---|---|---|---|---|---|---|---|---|---|---|---|
| 1995 | 0 | 0 | 0 | 0 | 0 | 0 | 0 | 0 | 0 | 0 | 0 | 0 |
| 1996 | 100 | 0 | 0 | 0 | 0 | 0 | 156 | 0 | 0 | 0 | 0 | 0 |
| 1997 | 0 | 0 | 0 | 0 | 120 | 0 | 0 | 0 | 0 | 0 | 0 | 0 |
| 1998 | 0 | 0 | 0 | 0 | 0 | 0 | 0 | 0 | 0 | 156 | 0 | 0 |
| 1999 | 0 | 0 | 0 | 0 | 0 | 0 | 35 | 0 | 0 | 0 | 29 | 0 |
| 2000 | 0 | 0 | 0 | 0 | 0 | 14 | 0 | 0 | 22 | 0 | 321 | 0 |
| 2001 | 0 | 20 | 0 | 0 | 0 | 0 | 0 | 0 | 0 | 0 | 0 | 0 |
| 2002 | 150 | 0 | 0 | 0 | 0 | 0 | 0 | 218 | 164 | 0 | 0 | 136 |
| 2003 | 0 | 0 | 0 | 0 | 0 | 565 | 0 | 0 | 0 | 147 | 194 | 0 |
| 2004 | 244 | 596 | 5 | 320 | ||||||||
| 2005 | 403 | 182 | 143 | 51 | ||||||||
| 2006 | 145 | 81 | 118 | 220 | 617 | |||||||
| 2007 | 258 | 324 | 358 | 525 | 30 | 234 | 100 | 386 | 329 | 258 | 431 | 458 |
| 2008 | 175 | 101 | 418 | 34 | 347 | 318 | 250 | 271 | ||||
| 2009 | 935 | 386 | 1,244 | 405 | 1,189 | 458 | 614 | 189 | 383 | 302 | 1,008 | 1,006 |
| 2010 | 2,363 | 1,500 | 1,391 | 1,225 | 553 | 727 | 689 | 548 | 297 | 1,743 | 1,268 | 432 |
| 2011 | 968 | 473 | 102 | 450 | 202 | 643 | 639 | 822 | 1,293 | 1,493 | 326 | |
| 2012 | 915 | 1,592 | 898 | 330 | 753 | 415 | 1,017 | 923 | 1,121 | 873 | 355 | |
| 2013 | 511 | 9 | 1,155 | 181 | 62 | 1,142 | 408 | 32 | 1,021 | 390 | 334 | |
| 2014 | 641 | 383 | 210 | 690 | 586 | 1,311 | 963 | 22 | 375 | 671 | 544 | |
| 2015 | 260 | 536 | 651 | 730 | 2,078 | 1,788 | 1,744 | 1,453 | 913 | 432 | 302 | 524 |
| 2016 | 653 | 320 | 979 | 1,079 | 1,002 | 1,877 | 960 | 1,077 | 106 | 116 | 1,128 | 331 |
| 2017 | 1,528 | 340 | 603 | 322 | 180 | 576 | 305 | 319 | ||||
| 2018 | 44 | 983 | 1,116 | 752 | 1,328 | 886 | 434 | 828 | 390 | |||
| 2019 | 156 | 974 | 826 | 1,066 | 890 | 931 | 1,310 | 127 | 590 | 849 | ||
| 2020 | 296 | 754 | 863 | 116 | 158 | 246 | 180 | 104 | ||||
| 2021 | 687 | 239 | 1,095 | 1,183 | 1,008 | 772 | 689 | 330 | 3 | 319 | ||
| 2022 | 320 | 312 | 306 | 346 | 667 | 476 | 927 | 306 | 722 | 460 | 639 | |
| 2023 | 644 | 330 | 678 | 900 | 1,583 | 1,215 | 938 | 722 | 335 | 18 | 238 | |
| 2024 | 321 | 486 | 315 | 414 | ||||||||
| - = No Data Reported; -- = Not Applicable; NA = Not Available; W = Withheld to avoid disclosure of individual company data. |
| Release Date: 8/30/2024 |
| Next Release Date: 9/30/2024 |