|
Download Data (XLS File) |
|
||||||||
|
||||||||
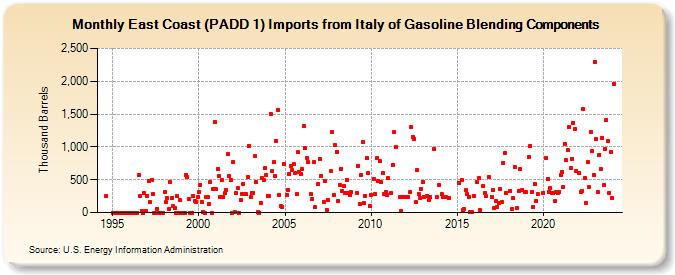
| East Coast (PADD 1) Imports from Italy of Gasoline Blending Components (Thousand Barrels) | ||||||||
| Year | Jan | Feb | Mar | Apr | May | Jun | Jul | Aug | Sep | Oct | Nov | Dec |
|---|---|---|---|---|---|---|---|---|---|---|---|---|
| 1994 | 252 | |||||||||||
| 1995 | 0 | 0 | 0 | 0 | 0 | 0 | 0 | 0 | 0 | 0 | 0 | 0 |
| 1996 | 0 | 0 | 0 | 0 | 0 | 0 | 578 | 246 | 23 | 0 | 292 | 31 |
| 1997 | 254 | 480 | 154 | 494 | 281 | 0 | 0 | 55 | 0 | 0 | 0 | 0 |
| 1998 | 310 | 156 | 219 | 51 | 470 | 220 | 95 | 71 | 0 | 248 | 0 | 185 |
| 1999 | 0 | 0 | 0 | 568 | 535 | 203 | 0 | 0 | 252 | 182 | 168 | 230 |
| 2000 | 317 | 426 | 165 | 10 | 0 | 240 | 244 | 135 | 472 | 0 | 353 | 1,381 |
| 2001 | 353 | 665 | 560 | 241 | 493 | 244 | 293 | 345 | 895 | 559 | 495 | 0 |
| 2002 | 774 | 5 | 293 | 371 | 0 | 190 | 282 | 431 | 281 | 277 | 544 | 1,018 |
| 2003 | 236 | 305 | 303 | 859 | 467 | 6 | 0 | 150 | 523 | 502 | 674 | 571 |
| 2004 | 255 | 249 | 1,500 | 631 | 770 | 556 | 1,097 | 1,566 | 274 | 98 | 86 | 740 |
| 2005 | 266 | 341 | 591 | 712 | 643 | 732 | 606 | 284 | 921 | 616 | 594 | |
| 2006 | 659 | 1,320 | 976 | 824 | 776 | 285 | 213 | 767 | 80 | 439 | ||
| 2007 | 818 | 562 | 162 | 485 | 38 | 189 | 628 | 1,228 | 274 | 1,022 | ||
| 2008 | 929 | 171 | 427 | 660 | 322 | 411 | 295 | 500 | 294 | 263 | 313 | |
| 2009 | 300 | 713 | 127 | 577 | 1,069 | 152 | 254 | 832 | 605 | 100 | ||
| 2010 | 268 | 510 | 282 | 835 | 484 | 783 | 461 | 598 | 278 | 314 | 273 | |
| 2011 | 521 | 291 | 730 | 1,225 | 998 | 234 | 28 | 240 | 234 | |||
| 2012 | 235 | 235 | 232 | 313 | 1,304 | 1,149 | 1,124 | 154 | 651 | 283 | 224 | 364 |
| 2013 | 466 | 236 | 248 | 191 | 232 | 966 | 233 | 417 | ||||
| 2014 | 283 | 232 | 233 | 216 | ||||||||
| 2015 | 445 | 493 | 33 | 52 | 338 | 282 | 233 | 1 | 2 | |||
| 2016 | 257 | 459 | 531 | 35 | 403 | 298 | 248 | 542 | ||||
| 2017 | 234 | 337 | 62 | 183 | 92 | 150 | 358 | 160 | 759 | 902 | 298 | |
| 2018 | 325 | 57 | 221 | 695 | 66 | 326 | 660 | 347 | 317 | |||
| 2019 | 312 | 848 | 1,015 | 319 | 88 | 430 | 173 | 279 | ||||
| 2020 | 304 | 835 | 509 | 309 | 369 | 299 | 297 | 176 | 310 | 295 | 311 | |
| 2021 | 570 | 617 | 383 | 1,045 | 795 | 949 | 1,305 | 679 | 820 | 1,365 | 1,274 | 638 |
| 2022 | 596 | 314 | 325 | 1,572 | 519 | 150 | 776 | 385 | 1,229 | 932 | 574 | |
| 2023 | 2,294 | 1,119 | 311 | 878 | 659 | 1,143 | 416 | 967 | 1,414 | 1,086 | 297 | 923 |
| 2024 | 227 | |||||||||||
| - = No Data Reported; -- = Not Applicable; NA = Not Available; W = Withheld to avoid disclosure of individual company data. |
| Release Date: 3/29/2024 |
| Next Release Date: 4/30/2024 |