|
Download Data (XLS File) |
|
||||||||
|
||||||||
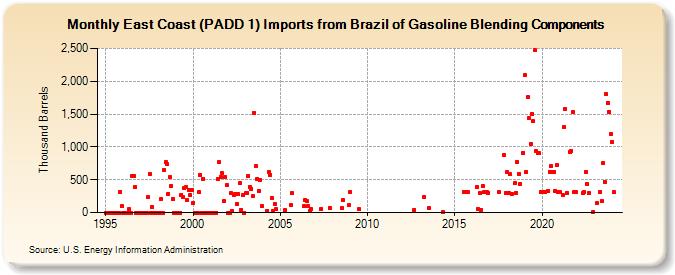
| East Coast (PADD 1) Imports from Brazil of Gasoline Blending Components (Thousand Barrels) | ||||||||
| Year | Jan | Feb | Mar | Apr | May | Jun | Jul | Aug | Sep | Oct | Nov | Dec |
|---|---|---|---|---|---|---|---|---|---|---|---|---|
| 1995 | 0 | 0 | 0 | 0 | 0 | 0 | 0 | 0 | 0 | 0 | 315 | 97 |
| 1996 | 0 | 0 | 0 | 0 | 48 | 0 | 556 | 559 | 386 | 0 | 0 | 0 |
| 1997 | 0 | 0 | 0 | 0 | 0 | 231 | 590 | 0 | 81 | 0 | 0 | 0 |
| 1998 | 0 | 0 | 199 | 0 | 650 | 768 | 733 | 287 | 541 | 406 | 214 | 0 |
| 1999 | 0 | 0 | 0 | 0 | 273 | 233 | 367 | 383 | 189 | 342 | 269 | 346 |
| 2000 | 151 | 0 | 0 | 0 | 313 | 576 | 0 | 518 | 0 | 0 | 0 | 0 |
| 2001 | 0 | 0 | 0 | 0 | 0 | 516 | 763 | 547 | 597 | 170 | 543 | 416 |
| 2002 | 0 | 0 | 293 | 21 | 266 | 285 | 127 | 280 | 446 | 40 | 262 | 0 |
| 2003 | 293 | 304 | 563 | 396 | 364 | 248 | 1,520 | 703 | 517 | 332 | 501 | 99 |
| 2004 | 28 | 624 | 574 | 222 | 27 | 137 | 50 | |||||
| 2005 | 32 | 112 | 293 | |||||||||
| 2006 | 93 | 186 | 175 | 96 | 25 | 50 | ||||||
| 2007 | 56 | 72 | ||||||||||
| 2008 | 71 | 185 | 114 | |||||||||
| 2009 | 314 | 47 | ||||||||||
| 2012 | 43 | |||||||||||
| 2013 | 238 | 68 | ||||||||||
| 2014 | 11 | |||||||||||
| 2015 | 317 | 310 | 306 | |||||||||
| 2016 | 395 | 56 | 295 | 37 | 408 | 309 | 311 | 301 | ||||
| 2017 | 312 | 872 | 303 | |||||||||
| 2018 | 616 | 296 | 585 | 288 | 443 | 305 | 767 | 591 | 437 | 907 | ||
| 2019 | 2,091 | 614 | 1,754 | 1,441 | 1,046 | 1,504 | 1,392 | 2,474 | 937 | 908 | 901 | 312 |
| 2020 | 310 | 310 | 316 | 335 | 625 | 705 | 618 | 625 | 334 | 717 | 310 | |
| 2021 | 312 | 275 | 1,305 | 1,577 | 302 | 924 | 941 | 1,525 | 313 | 312 | ||
| 2022 | 298 | 309 | 620 | 432 | 299 | 15 | ||||||
| 2023 | 143 | 315 | 179 | 758 | 469 | 1,805 | 1,676 | 1,532 | 1,191 | |||
| 2024 | 1,072 | |||||||||||
| - = No Data Reported; -- = Not Applicable; NA = Not Available; W = Withheld to avoid disclosure of individual company data. |
| Release Date: 3/29/2024 |
| Next Release Date: 4/30/2024 |