|
Download Data (XLS File) |
|
||||||||
|
||||||||
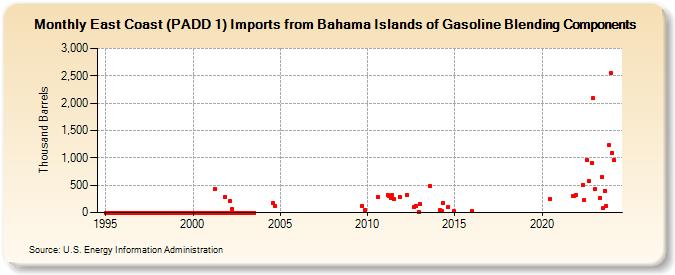
| East Coast (PADD 1) Imports from Bahama Islands of Gasoline Blending Components (Thousand Barrels) | ||||||||
| Year | Jan | Feb | Mar | Apr | May | Jun | Jul | Aug | Sep | Oct | Nov | Dec |
|---|---|---|---|---|---|---|---|---|---|---|---|---|
| 1995 | 0 | 0 | 0 | 0 | 0 | 0 | 0 | 0 | 0 | 0 | 0 | 0 |
| 1996 | 0 | 0 | 0 | 0 | 0 | 0 | 0 | 0 | 0 | 0 | 0 | 0 |
| 1997 | 0 | 0 | 0 | 0 | 0 | 0 | 0 | 0 | 0 | 0 | 0 | 0 |
| 1998 | 0 | 0 | 0 | 0 | 0 | 0 | 0 | 0 | 0 | 0 | 0 | 0 |
| 1999 | 0 | 0 | 0 | 0 | 0 | 0 | 0 | 0 | 0 | 0 | 0 | 0 |
| 2000 | 0 | 0 | 0 | 0 | 0 | 0 | 0 | 0 | 0 | 0 | 0 | 0 |
| 2001 | 0 | 0 | 0 | 429 | 0 | 0 | 0 | 0 | 0 | 0 | 289 | 0 |
| 2002 | 0 | 211 | 0 | 63 | 0 | 0 | 0 | 0 | 0 | 0 | 0 | 0 |
| 2003 | 0 | 0 | 0 | 0 | 0 | 0 | 0 | |||||
| 2004 | 175 | 129 | ||||||||||
| 2009 | 123 | 53 | ||||||||||
| 2010 | 281 | |||||||||||
| 2011 | 320 | 302 | 265 | 323 | 250 | 290 | ||||||
| 2012 | 322 | 100 | 125 | 15 | ||||||||
| 2013 | 150 | 483 | ||||||||||
| 2014 | 38 | 26 | 170 | 96 | 27 | |||||||
| 2016 | 20 | |||||||||||
| 2020 | 248 | |||||||||||
| 2021 | 295 | 310 | 315 | |||||||||
| 2022 | 509 | 227 | 956 | 569 | 907 | 2,085 | ||||||
| 2023 | 424 | 275 | 646 | 75 | 401 | 126 | 1,226 | 2,545 | ||||
| 2024 | 1,095 | 969 | 462 | 498 | 869 | 610 | ||||||
| - = No Data Reported; -- = Not Applicable; NA = Not Available; W = Withheld to avoid disclosure of individual company data. |
| Release Date: 8/30/2024 |
| Next Release Date: 9/30/2024 |