|
Download Data (XLS File) |
|
||||||||
|
||||||||
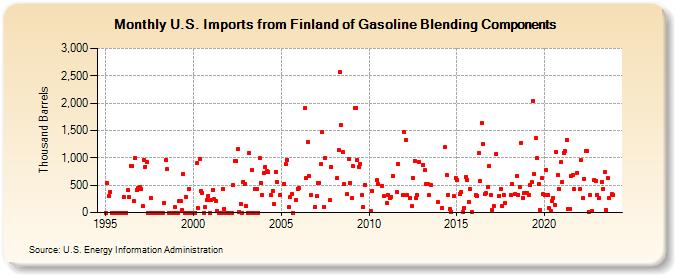
| U.S. Imports from Finland of Gasoline Blending Components (Thousand Barrels) | ||||||||
| Year | Jan | Feb | Mar | Apr | May | Jun | Jul | Aug | Sep | Oct | Nov | Dec |
|---|---|---|---|---|---|---|---|---|---|---|---|---|
| 1995 | 0 | 532 | 298 | 380 | 0 | 0 | 0 | 0 | 0 | 0 | 0 | 0 |
| 1996 | 288 | 0 | 0 | 408 | 277 | 855 | 851 | 203 | 1,000 | 404 | 441 | 461 |
| 1997 | 438 | 111 | 962 | 839 | 917 | 0 | 0 | 274 | 0 | 0 | 0 | 0 |
| 1998 | 0 | 0 | 0 | 0 | 183 | 967 | 795 | 0 | 0 | 0 | 0 | 105 |
| 1999 | 0 | 0 | 204 | 205 | 48 | 709 | 0 | 286 | 0 | 435 | 0 | 0 |
| 2000 | 0 | 0 | 897 | 75 | 978 | 398 | 357 | 0 | 100 | 238 | 300 | 0 |
| 2001 | 230 | 410 | 241 | 220 | 37 | 0 | 0 | 0 | 431 | 74 | 0 | 0 |
| 2002 | 0 | 0 | 0 | 501 | 937 | 938 | 1,161 | 15 | 157 | 0 | 559 | 528 |
| 2003 | 119 | 0 | 1,097 | 0 | 776 | 0 | 437 | 432 | 0 | 990 | 538 | 324 |
| 2004 | 721 | 833 | 762 | 742 | 315 | 403 | 154 | 745 | 562 | 315 | ||
| 2005 | 529 | 879 | 966 | 100 | 277 | 348 | 1 | 236 | 438 | |||
| 2006 | 441 | 1,902 | 625 | 1,288 | 662 | 329 | 100 | |||||
| 2007 | 301 | 549 | 549 | 879 | 1,467 | 109 | 1,002 | 230 | 837 | |||
| 2008 | 631 | 1,139 | 2,571 | 1,599 | 1,106 | 516 | 333 | 976 | 548 | |||
| 2009 | 261 | 849 | 1,909 | 1,907 | 963 | 834 | 883 | 317 | 98 | 511 | ||
| 2010 | 26 | 403 | 590 | 530 | 494 | 294 | ||||||
| 2011 | 176 | 320 | 263 | 293 | 672 | 374 | 896 | 320 | ||||
| 2012 | 1,470 | 1,333 | 325 | 257 | 115 | 638 | 945 | 259 | 324 | 928 | ||
| 2013 | 870 | 770 | 528 | 531 | 318 | 510 | 192 | |||||
| 2014 | 90 | 1,189 | 680 | 323 | 58 | 16 | 295 | 634 | ||||
| 2015 | 604 | 335 | 381 | 10 | 83 | 658 | 589 | 202 | 427 | 2 | ||
| 2016 | 312 | 311 | 1,088 | 576 | 1,637 | 1,252 | 333 | 350 | 458 | 851 | 326 | |
| 2017 | 39 | 112 | 1,071 | 310 | 437 | 117 | 323 | 183 | ||||
| 2018 | 315 | 531 | 336 | 666 | 330 | 465 | 1,279 | 264 | 354 | |||
| 2019 | 354 | 312 | 495 | 562 | 2,035 | 708 | 1,369 | 989 | 519 | 50 | 628 | 334 |
| 2020 | 319 | 780 | 312 | 77 | 29 | 215 | 268 | 145 | 1,114 | 686 | 433 | 918 |
| 2021 | 554 | 1,093 | 1,118 | 1,333 | 64 | 62 | 662 | 682 | 429 | 729 | ||
| 2022 | 432 | 952 | 263 | 620 | 1,126 | 1,121 | 8 | 324 | 22 | 593 | 583 | |
| 2023 | 328 | 261 | 559 | 431 | 736 | 55 | 629 | 271 | 339 | 322 | ||
| - = No Data Reported; -- = Not Applicable; NA = Not Available; W = Withheld to avoid disclosure of individual company data. |
| Release Date: 3/29/2024 |
| Next Release Date: 4/30/2024 |