|
Download Data (XLS File) |
|
||||||||
|
||||||||
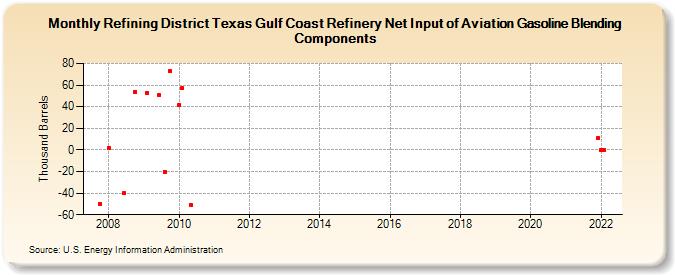
| Refining District Texas Gulf Coast Refinery Net Input of Aviation Gasoline Blending Components (Thousand Barrels) | ||||||||
| Year | Jan | Feb | Mar | Apr | May | Jun | Jul | Aug | Sep | Oct | Nov | Dec |
|---|---|---|---|---|---|---|---|---|---|---|---|---|
| 2007 | -50 | |||||||||||
| 2008 | 2 | -40 | 54 | |||||||||
| 2009 | 53 | 51 | -20 | 73 | ||||||||
| 2010 | 42 | 57 | -51 | |||||||||
| 2021 | 11 | |||||||||||
| 2022 | 0 | 0 | ||||||||||
| - = No Data Reported; -- = Not Applicable; NA = Not Available; W = Withheld to avoid disclosure of individual company data. |
| Release Date: 8/30/2024 |
| Next Release Date: 9/30/2024 |