|
Download Data (XLS File) |
|
||||||||
|
||||||||
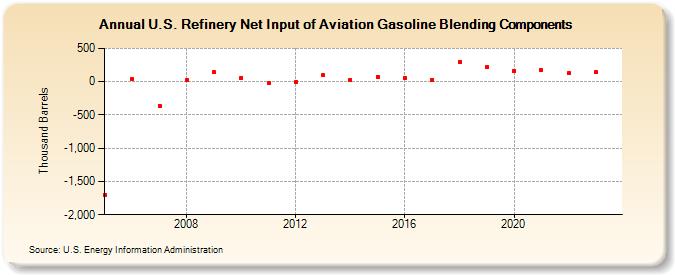
| U.S. Refinery Net Input of Aviation Gasoline Blending Components (Thousand Barrels) | ||||||||
| Decade | Year-0 | Year-1 | Year-2 | Year-3 | Year-4 | Year-5 | Year-6 | Year-7 | Year-8 | Year-9 |
|---|---|---|---|---|---|---|---|---|---|---|
| 2000's | -1,702 | 34 | -362 | 19 | 141 | |||||
| 2010's | 55 | -17 | -2 | 95 | 26 | 70 | 57 | 32 | 292 | 225 |
| 2020's | 167 | 171 | 123 | 139 |
| - = No Data Reported; -- = Not Applicable; NA = Not Available; W = Withheld to avoid disclosure of individual company data. |
| Release Date: 8/30/2024 |
| Next Release Date: 8/29/2025 |