|
Download Data (XLS File) |
|
||||||||
|
||||||||
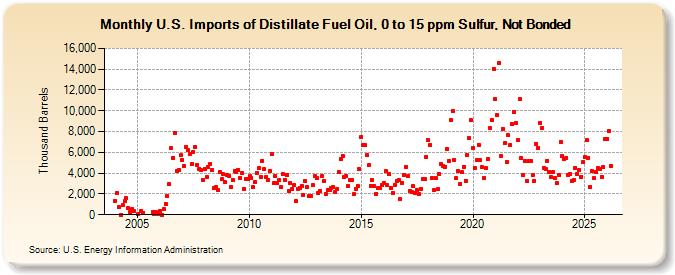
| U.S. Imports of Distillate Fuel Oil, 0 to 15 ppm Sulfur, Not Bonded (Thousand Barrels) | ||||||||
| Year | Jan | Feb | Mar | Apr | May | Jun | Jul | Aug | Sep | Oct | Nov | Dec |
|---|---|---|---|---|---|---|---|---|---|---|---|---|
| 2004 | 1,344 | 2,081 | 707 | 18 | 932 | 1,275 | 1,589 | 611 | 245 | 522 | 318 | |
| 2005 | 32 | 365 | 200 | 260 | 49 | 214 | 83 | |||||
| 2006 | 337 | 2 | 526 | 1,049 | 1,777 | 2,921 | 6,380 | 5,466 | 7,862 | 4,236 | 4,283 | 5,717 |
| 2007 | 5,274 | 4,711 | 6,501 | 6,193 | 5,881 | 4,859 | 6,071 | 6,550 | 4,783 | 4,434 | 4,255 | 3,354 |
| 2008 | 4,405 | 3,610 | 4,570 | 4,890 | 4,288 | 2,571 | 2,658 | 2,363 | 4,117 | 3,394 | 3,889 | 3,110 |
| 2009 | 3,853 | 3,732 | 2,703 | 3,312 | 4,211 | 4,110 | 4,333 | 3,535 | 3,990 | 2,515 | 3,418 | 3,448 |
| 2010 | 3,679 | 3,556 | 2,624 | 3,189 | 4,011 | 4,451 | 3,667 | 5,194 | 4,353 | 3,613 | 3,340 | 4,251 |
| 2011 | 5,811 | 3,026 | 3,768 | 3,073 | 3,306 | 2,630 | 3,891 | 3,375 | 3,799 | 2,268 | 3,037 | 2,466 |
| 2012 | 2,881 | 1,294 | 2,514 | 2,526 | 2,803 | 1,918 | 3,201 | 2,631 | 1,800 | 1,808 | 2,848 | 3,682 |
| 2013 | 3,514 | 2,082 | 2,303 | 3,742 | 3,228 | 1,970 | 2,363 | 2,408 | 2,532 | 2,660 | 2,188 | 2,448 |
| 2014 | 4,077 | 5,334 | 5,683 | 3,600 | 3,758 | 2,738 | 3,348 | 3,327 | 1,949 | 2,499 | 2,781 | 4,418 |
| 2015 | 7,428 | 6,706 | 6,723 | 5,700 | 4,751 | 2,810 | 3,378 | 2,740 | 2,006 | 2,540 | 2,530 | 2,849 |
| 2016 | 3,057 | 4,159 | 2,873 | 3,920 | 2,585 | 2,066 | 2,836 | 3,224 | 3,346 | 1,499 | 3,054 | 3,864 |
| 2017 | 4,592 | 3,763 | 2,283 | 2,179 | 2,732 | 2,131 | 2,363 | 1,968 | 2,514 | 3,424 | 3,477 | 5,586 |
| 2018 | 7,153 | 6,751 | 3,545 | 2,372 | 3,514 | 2,441 | 3,905 | 4,900 | 4,701 | 4,626 | 6,277 | 5,193 |
| 2019 | 9,129 | 10,001 | 5,242 | 3,514 | 4,252 | 2,998 | 4,065 | 4,638 | 3,272 | 5,725 | 7,346 | 9,068 |
| 2020 | 6,460 | 4,473 | 5,257 | 6,740 | 5,236 | 4,578 | 3,552 | 4,466 | 5,358 | 8,336 | 9,117 | 14,031 |
| 2021 | 11,084 | 9,558 | 14,581 | 5,619 | 8,289 | 6,888 | 5,089 | 7,633 | 6,727 | 8,687 | 9,902 | 8,816 |
| 2022 | 7,169 | 11,102 | 5,423 | 3,841 | 5,162 | 3,269 | 5,200 | 5,132 | 3,792 | 3,264 | 6,812 | 6,446 |
| 2023 | 8,357 | 8,383 | 4,534 | 4,420 | 5,200 | 4,131 | 3,698 | 4,124 | 3,561 | 3,055 | 3,773 | 6,940 |
| 2024 | 5,380 | |||||||||||
| - = No Data Reported; -- = Not Applicable; NA = Not Available; W = Withheld to avoid disclosure of individual company data. |
| Release Date: 3/29/2024 |
| Next Release Date: 4/30/2024 |