|
Download Data (XLS File) |
|
||||||||
|
||||||||
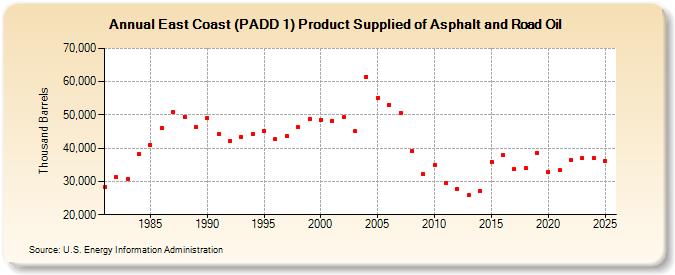
| East Coast (PADD 1) Product Supplied of Asphalt and Road Oil (Thousand Barrels) | ||||||||
| Decade | Year-0 | Year-1 | Year-2 | Year-3 | Year-4 | Year-5 | Year-6 | Year-7 | Year-8 | Year-9 |
|---|---|---|---|---|---|---|---|---|---|---|
| 1980's | 28,246 | 31,258 | 30,740 | 38,271 | 41,048 | 46,091 | 50,906 | 49,481 | 46,429 | |
| 1990's | 49,189 | 44,123 | 42,147 | 43,323 | 44,330 | 45,155 | 42,616 | 43,519 | 46,282 | 48,725 |
| 2000's | 48,582 | 48,286 | 49,266 | 45,052 | 61,399 | 55,164 | 53,059 | 50,604 | 39,167 | 32,190 |
| 2010's | 34,904 | 29,487 | 27,821 | 25,808 | 27,117 | 35,949 | 37,938 | 33,803 | 33,998 | 38,652 |
| 2020's | 32,817 | 33,375 | 36,490 | 37,007 |
| - = No Data Reported; -- = Not Applicable; NA = Not Available; W = Withheld to avoid disclosure of individual company data. |
| Release Date: 8/30/2024 |
| Next Release Date: 8/29/2025 |