|
Download Data (XLS File) |
|
||||||||
|
||||||||
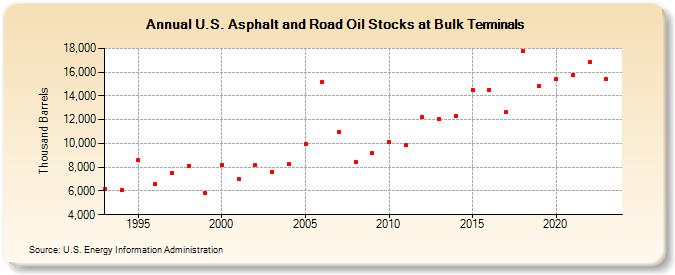
| U.S. Asphalt and Road Oil Stocks at Bulk Terminals (Thousand Barrels) | ||||||||
| Decade | Year-0 | Year-1 | Year-2 | Year-3 | Year-4 | Year-5 | Year-6 | Year-7 | Year-8 | Year-9 |
|---|---|---|---|---|---|---|---|---|---|---|
| 1990's | 6,203 | 6,076 | 8,623 | 6,560 | 7,510 | 8,135 | 5,791 | |||
| 2000's | 8,183 | 7,011 | 8,156 | 7,618 | 8,300 | 9,978 | 15,174 | 10,981 | 8,399 | 9,179 |
| 2010's | 10,156 | 9,907 | 12,186 | 12,020 | 12,302 | 14,528 | 14,532 | 12,664 | 17,769 | 14,809 |
| 2020's | 15,439 | 15,773 | 16,867 | 15,431 |
| - = No Data Reported; -- = Not Applicable; NA = Not Available; W = Withheld to avoid disclosure of individual company data. |
| Release Date: 8/30/2024 |
| Next Release Date: 8/29/2025 |