|
Download Data (XLS File) |
|
||||||||
|
||||||||
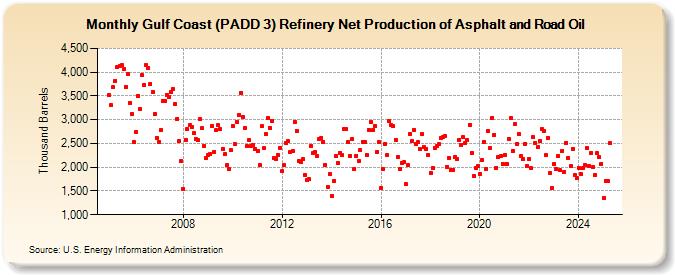
| Gulf Coast (PADD 3) Refinery Net Production of Asphalt and Road Oil (Thousand Barrels) | ||||||||
| Year | Jan | Feb | Mar | Apr | May | Jun | Jul | Aug | Sep | Oct | Nov | Dec |
|---|---|---|---|---|---|---|---|---|---|---|---|---|
| 2005 | 3,515 | 3,299 | 3,679 | 3,816 | 4,106 | 4,129 | 4,143 | 4,058 | 3,696 | 3,955 | 3,358 | 3,117 |
| 2006 | 2,535 | 2,744 | 3,504 | 3,226 | 3,936 | 3,740 | 4,152 | 4,095 | 3,755 | 3,591 | 3,119 | 2,624 |
| 2007 | 2,538 | 2,780 | 3,390 | 3,400 | 3,527 | 3,471 | 3,577 | 3,639 | 3,329 | 3,022 | 2,547 | 2,140 |
| 2008 | 1,544 | 2,581 | 2,799 | 2,880 | 2,838 | 2,717 | 2,601 | 2,566 | 3,014 | 2,818 | 2,456 | 2,196 |
| 2009 | 2,258 | 2,275 | 2,876 | 2,328 | 2,775 | 2,878 | 2,800 | 2,386 | 2,268 | 2,039 | 1,963 | 2,355 |
| 2010 | 2,873 | 2,482 | 2,949 | 3,097 | 3,570 | 3,056 | 2,833 | 2,436 | 2,566 | 2,439 | 2,463 | 2,381 |
| 2011 | 2,331 | 2,043 | 2,858 | 2,395 | 2,690 | 3,034 | 2,832 | 2,980 | 2,199 | 2,182 | 2,255 | 2,412 |
| 2012 | 1,911 | 2,037 | 2,501 | 2,543 | 2,327 | 2,345 | 2,958 | 2,770 | 2,135 | 2,104 | 2,162 | 1,842 |
| 2013 | 1,727 | 1,746 | 2,451 | 2,290 | 2,321 | 2,234 | 2,599 | 2,620 | 2,535 | 2,042 | 1,589 | 1,855 |
| 2014 | 1,398 | 1,706 | 2,228 | 2,092 | 2,308 | 2,252 | 2,802 | 2,794 | 2,525 | 2,243 | 2,588 | 1,970 |
| 2015 | 2,243 | 2,134 | 2,359 | 2,539 | 2,528 | 2,266 | 2,783 | 2,944 | 2,782 | 2,864 | 2,328 | 2,524 |
| 2016 | 1,570 | 1,970 | 2,494 | 2,259 | 2,970 | 2,885 | 2,859 | 2,582 | 2,215 | 1,953 | 2,090 | 2,101 |
| 2017 | 1,644 | 2,040 | 2,706 | 2,543 | 2,788 | 2,481 | 2,523 | 2,377 | 2,701 | 2,418 | 2,384 | 2,266 |
| 2018 | 1,885 | 1,976 | 2,411 | 2,441 | 2,483 | 2,617 | 2,627 | 2,648 | 2,008 | 2,199 | 1,945 | 1,951 |
| 2019 | 2,220 | 2,168 | 2,582 | 2,474 | 2,630 | 2,517 | 2,571 | 2,896 | 2,299 | 1,812 | 1,983 | 2,016 |
| 2020 | 1,862 | 2,152 | 2,529 | 1,968 | 2,753 | 2,408 | 3,040 | 2,685 | 1,991 | 2,207 | 2,227 | 2,071 |
| 2021 | 2,259 | 2,074 | 2,602 | 3,031 | 2,348 | 2,902 | 2,494 | 2,694 | 2,233 | 2,172 | 2,495 | 2,026 |
| 2022 | 2,173 | 1,973 | 2,625 | 2,519 | 2,418 | 2,547 | 2,806 | 2,759 | 2,253 | 2,624 | 1,880 | 1,568 |
| 2023 | 2,072 | 1,962 | 2,230 | 1,934 | 2,339 | 1,900 | 2,519 | 2,198 | 2,019 | 2,391 | 1,835 | 1,777 |
| 2024 | 1,989 | 1,857 | 1,974 | 2,047 | 2,408 | 2,022 | ||||||
| - = No Data Reported; -- = Not Applicable; NA = Not Available; W = Withheld to avoid disclosure of individual company data. |
| Release Date: 8/30/2024 |
| Next Release Date: 9/30/2024 |