|
Download Data (XLS File) |
|
||||||||
|
||||||||
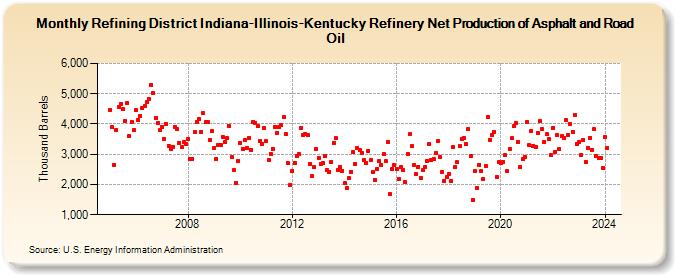
| Refining District Indiana-Illinois-Kentucky Refinery Net Production of Asphalt and Road Oil (Thousand Barrels) | ||||||||
| Year | Jan | Feb | Mar | Apr | May | Jun | Jul | Aug | Sep | Oct | Nov | Dec |
|---|---|---|---|---|---|---|---|---|---|---|---|---|
| 2005 | 4,475 | 3,893 | 2,655 | 3,803 | 4,556 | 4,664 | 4,483 | 4,093 | 4,694 | 3,587 | 4,075 | 3,810 |
| 2006 | 4,454 | 4,140 | 4,265 | 4,513 | 4,598 | 4,712 | 4,819 | 5,300 | 5,009 | 4,207 | 4,030 | 3,799 |
| 2007 | 3,914 | 3,513 | 3,999 | 3,285 | 3,189 | 3,247 | 3,914 | 3,818 | 3,381 | 3,229 | 3,417 | 3,346 |
| 2008 | 3,519 | 2,826 | 2,834 | 3,723 | 4,073 | 4,172 | 3,750 | 4,357 | 4,055 | 4,065 | 3,469 | 3,766 |
| 2009 | 3,218 | 2,844 | 3,307 | 3,306 | 3,580 | 3,412 | 3,520 | 3,931 | 2,914 | 2,466 | 2,062 | 2,768 |
| 2010 | 3,355 | 3,187 | 3,474 | 3,213 | 3,531 | 3,154 | 4,074 | 4,039 | 3,922 | 3,440 | 3,350 | 3,868 |
| 2011 | 3,428 | 2,811 | 3,012 | 3,186 | 3,915 | 3,710 | 3,896 | 3,950 | 4,215 | 3,666 | 2,715 | 1,980 |
| 2012 | 2,461 | 2,724 | 2,943 | 2,995 | 3,870 | 3,624 | 3,661 | 3,629 | 2,691 | 2,264 | 2,563 | 3,171 |
| 2013 | 2,877 | 2,683 | 2,721 | 2,943 | 2,484 | 2,418 | 2,744 | 3,383 | 3,528 | 2,479 | 2,572 | 2,458 |
| 2014 | 2,047 | 1,894 | 2,210 | 2,423 | 3,066 | 2,689 | 3,201 | 3,128 | 3,056 | 2,816 | 2,718 | 3,123 |
| 2015 | 2,807 | 2,405 | 2,147 | 2,515 | 2,767 | 2,650 | 3,015 | 2,767 | 3,397 | 1,670 | 2,496 | 2,629 |
| 2016 | 2,513 | 2,195 | 2,575 | 2,464 | 2,074 | 3,001 | 3,653 | 3,258 | 2,650 | 2,349 | 2,594 | 2,213 |
| 2017 | 2,464 | 2,577 | 2,788 | 3,340 | 2,815 | 2,858 | 3,043 | 3,430 | 2,913 | 2,424 | 2,122 | 2,248 |
| 2018 | 2,360 | 2,130 | 3,240 | 2,589 | 2,727 | 3,260 | 3,507 | 3,544 | 3,339 | 3,841 | 2,939 | 1,499 |
| 2019 | 2,443 | 1,868 | 2,654 | 2,439 | 2,193 | 2,627 | 4,225 | 3,472 | 3,630 | 3,739 | 2,261 | 2,733 |
| 2020 | 2,710 | 2,744 | 2,962 | 2,445 | 3,177 | 3,520 | 3,921 | 4,034 | 3,416 | 2,568 | 2,834 | 2,904 |
| 2021 | 4,058 | 3,290 | 3,769 | 3,281 | 3,237 | 3,718 | 4,095 | 3,833 | 3,417 | 3,659 | 3,510 | 2,975 |
| 2022 | 3,868 | 3,089 | 3,624 | 3,164 | 3,591 | 3,547 | 4,127 | 3,651 | 4,014 | 3,751 | 4,289 | 3,336 |
| 2023 | 3,389 | 2,990 | 3,463 | 2,755 | 3,221 | 3,547 | 3,149 | 3,820 | 2,928 | 2,879 | 2,872 | 2,547 |
| 2024 | 3,554 | |||||||||||
| - = No Data Reported; -- = Not Applicable; NA = Not Available; W = Withheld to avoid disclosure of individual company data. |
| Release Date: 3/29/2024 |
| Next Release Date: 4/30/2024 |