|
Download Data (XLS File) |
|
||||||||
|
||||||||
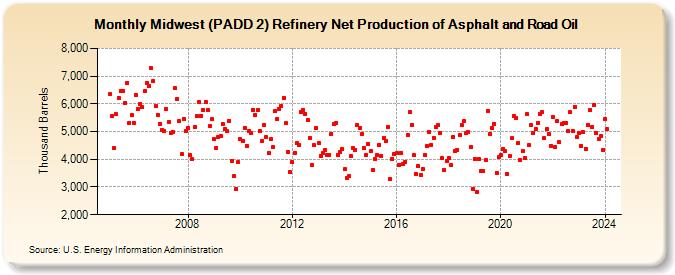
| Midwest (PADD 2) Refinery Net Production of Asphalt and Road Oil (Thousand Barrels) | ||||||||
| Year | Jan | Feb | Mar | Apr | May | Jun | Jul | Aug | Sep | Oct | Nov | Dec |
|---|---|---|---|---|---|---|---|---|---|---|---|---|
| 2005 | 6,340 | 5,553 | 4,399 | 5,620 | 6,212 | 6,451 | 6,445 | 6,040 | 6,762 | 5,321 | 5,589 | 5,310 |
| 2006 | 6,336 | 5,831 | 5,998 | 5,894 | 6,448 | 6,743 | 6,642 | 7,283 | 6,821 | 5,912 | 5,614 | 5,274 |
| 2007 | 5,055 | 5,002 | 5,807 | 5,351 | 4,937 | 4,996 | 6,562 | 6,171 | 5,368 | 4,187 | 5,454 | 5,017 |
| 2008 | 5,122 | 4,144 | 3,994 | 5,164 | 5,566 | 6,071 | 5,572 | 5,780 | 6,075 | 5,776 | 5,213 | 5,437 |
| 2009 | 4,726 | 4,412 | 4,815 | 4,852 | 5,273 | 5,106 | 5,004 | 5,395 | 3,951 | 3,380 | 2,934 | 3,892 |
| 2010 | 4,718 | 4,668 | 5,142 | 4,485 | 5,003 | 4,957 | 5,776 | 5,592 | 5,783 | 5,005 | 4,653 | 5,223 |
| 2011 | 4,795 | 4,227 | 4,715 | 4,425 | 5,733 | 5,458 | 5,819 | 5,929 | 6,225 | 5,299 | 4,264 | 3,527 |
| 2012 | 3,900 | 4,230 | 4,571 | 4,515 | 5,712 | 5,785 | 5,649 | 5,421 | 4,769 | 3,805 | 4,507 | 5,122 |
| 2013 | 4,577 | 4,134 | 4,214 | 4,325 | 4,152 | 4,167 | 4,909 | 5,270 | 5,302 | 4,165 | 4,253 | 4,358 |
| 2014 | 3,632 | 3,337 | 3,386 | 4,107 | 4,399 | 4,343 | 5,242 | 5,134 | 4,913 | 4,393 | 4,160 | 4,552 |
| 2015 | 4,296 | 3,622 | 3,996 | 4,150 | 4,524 | 4,125 | 4,780 | 4,667 | 5,170 | 3,289 | 4,025 | 4,186 |
| 2016 | 4,224 | 3,794 | 4,244 | 3,833 | 3,917 | 4,877 | 5,712 | 5,250 | 4,145 | 3,468 | 3,763 | 3,421 |
| 2017 | 3,647 | 4,155 | 4,484 | 4,997 | 4,515 | 4,777 | 5,151 | 5,227 | 4,935 | 4,037 | 3,615 | 3,938 |
| 2018 | 4,035 | 3,789 | 4,787 | 4,299 | 4,352 | 4,861 | 5,228 | 5,377 | 4,933 | 4,973 | 4,433 | 2,940 |
| 2019 | 4,024 | 2,837 | 4,004 | 3,582 | 3,575 | 3,971 | 5,742 | 4,924 | 5,126 | 5,286 | 3,519 | 4,077 |
| 2020 | 4,140 | 4,381 | 4,282 | 3,473 | 4,122 | 4,758 | 5,579 | 5,492 | 4,587 | 3,971 | 4,284 | 4,051 |
| 2021 | 5,622 | 4,506 | 5,227 | 4,941 | 5,108 | 5,321 | 5,649 | 5,701 | 4,762 | 5,085 | 4,896 | 4,491 |
| 2022 | 5,532 | 4,455 | 5,373 | 4,618 | 5,281 | 5,313 | 5,316 | 5,016 | 5,688 | 5,032 | 5,888 | 4,803 |
| 2023 | 4,965 | 4,471 | 4,972 | 4,385 | 5,238 | 5,775 | 5,171 | 5,957 | 4,958 | 4,730 | 4,826 | 4,335 |
| 2024 | 5,460 | |||||||||||
| - = No Data Reported; -- = Not Applicable; NA = Not Available; W = Withheld to avoid disclosure of individual company data. |
| Release Date: 3/29/2024 |
| Next Release Date: 4/30/2024 |