|
Download Data (XLS File) |
|
||||||||
|
||||||||
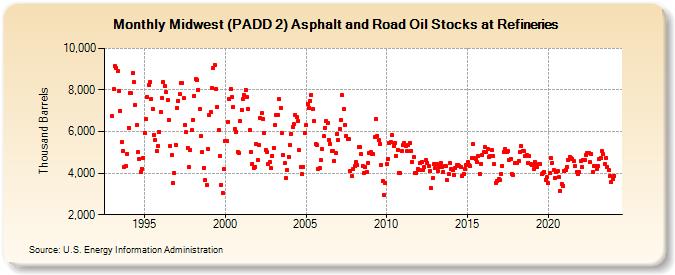
| Midwest (PADD 2) Asphalt and Road Oil Stocks at Refineries (Thousand Barrels) | ||||||||
| Year | Jan | Feb | Mar | Apr | May | Jun | Jul | Aug | Sep | Oct | Nov | Dec |
|---|---|---|---|---|---|---|---|---|---|---|---|---|
| 1993 | 6,734 | 8,026 | 9,133 | 9,060 | 8,904 | 7,967 | 6,999 | 5,507 | 5,056 | 4,313 | 4,336 | 4,943 |
| 1994 | 6,192 | 7,876 | 7,838 | 8,811 | 8,381 | 7,295 | 6,292 | 4,994 | 4,699 | 4,054 | 4,216 | 4,748 |
| 1995 | 5,925 | 6,614 | 7,660 | 8,220 | 8,385 | 7,561 | 7,097 | 5,851 | 5,609 | 5,057 | 5,316 | 6,000 |
| 1996 | 6,941 | 7,603 | 8,377 | 8,173 | 7,880 | 7,518 | 6,557 | 5,325 | 4,880 | 3,544 | 3,999 | 5,368 |
| 1997 | 7,137 | 7,489 | 7,793 | 8,325 | 8,327 | 7,625 | 6,318 | 5,962 | 5,230 | 4,272 | 5,118 | 6,062 |
| 1998 | 6,579 | 7,734 | 8,518 | 8,486 | 8,012 | 7,090 | 5,805 | 5,016 | 4,267 | 3,647 | 3,444 | 5,175 |
| 1999 | 6,797 | 6,938 | 8,093 | 9,080 | 9,220 | 8,061 | 7,202 | 6,071 | 4,809 | 3,447 | 3,054 | 4,177 |
| 2000 | 5,540 | 5,552 | 6,465 | 7,542 | 8,052 | 7,650 | 7,187 | 6,129 | 5,987 | 5,034 | 4,975 | 6,499 |
| 2001 | 7,053 | 7,543 | 7,740 | 7,989 | 7,648 | 7,075 | 6,080 | 5,040 | 4,458 | 4,260 | 4,311 | 5,391 |
| 2002 | 4,635 | 5,361 | 6,640 | 6,877 | 6,615 | 5,952 | 5,123 | 5,001 | 4,426 | 4,532 | 4,229 | 4,846 |
| 2003 | 5,222 | 6,308 | 6,817 | 6,813 | 7,545 | 7,151 | 5,918 | 4,888 | 4,483 | 3,760 | 4,162 | 4,791 |
| 2004 | 5,355 | 5,900 | 6,218 | 6,355 | 6,797 | 6,691 | 6,484 | 5,091 | 4,315 | 3,949 | 4,306 | 5,932 |
| 2005 | 6,296 | 7,330 | 7,136 | 7,490 | 7,782 | 7,082 | 6,489 | 5,391 | 5,344 | 4,217 | 4,247 | 4,629 |
| 2006 | 5,158 | 5,770 | 6,185 | 6,506 | 6,435 | 5,617 | 5,410 | 5,062 | 5,048 | 4,590 | 4,977 | 5,898 |
| 2007 | 5,595 | 6,113 | 6,559 | 7,745 | 7,096 | 6,313 | 5,810 | 5,650 | 5,619 | 4,121 | 3,845 | 4,191 |
| 2008 | 4,338 | 4,532 | 4,380 | 5,258 | 5,234 | 4,920 | 4,349 | 4,028 | 4,277 | 4,052 | 4,487 | 4,987 |
| 2009 | 5,006 | 4,932 | 4,920 | 5,729 | 6,588 | 5,806 | 5,576 | 5,408 | 4,393 | 3,599 | 2,949 | 3,505 |
| 2010 | 4,426 | 4,683 | 5,435 | 5,495 | 5,826 | 5,311 | 5,445 | 4,825 | 5,135 | 4,021 | 3,994 | 5,054 |
| 2011 | 5,356 | 5,466 | 5,305 | 5,060 | 5,375 | 5,456 | 5,080 | 4,553 | 4,761 | 4,003 | 3,983 | 4,206 |
| 2012 | 4,158 | 4,502 | 4,540 | 4,160 | 4,286 | 4,610 | 4,505 | 4,364 | 4,094 | 3,271 | 3,765 | 4,418 |
| 2013 | 4,228 | 4,459 | 4,091 | 4,282 | 4,501 | 4,298 | 4,063 | 4,320 | 4,325 | 3,650 | 3,947 | 4,481 |
| 2014 | 4,207 | 4,135 | 3,912 | 4,239 | 4,387 | 4,382 | 4,336 | 4,298 | 3,885 | 3,966 | 4,200 | 4,395 |
| 2015 | 4,533 | 4,390 | 4,322 | 4,731 | 5,394 | 4,714 | 4,662 | 4,522 | 4,835 | 3,976 | 4,462 | 4,893 |
| 2016 | 5,008 | 5,233 | 5,013 | 5,147 | 4,788 | 4,809 | 5,124 | 4,844 | 4,418 | 3,541 | 3,645 | 3,729 |
| 2017 | 3,650 | 3,978 | 4,365 | 5,028 | 5,164 | 5,039 | 5,045 | 4,627 | 4,698 | 3,963 | 3,932 | 4,494 |
| 2018 | 4,497 | 4,498 | 4,573 | 5,013 | 5,292 | 5,070 | 5,054 | 4,822 | 4,889 | 4,502 | 4,817 | 4,433 |
| 2019 | 4,394 | 4,177 | 4,550 | 4,415 | 4,315 | 4,459 | 4,434 | 3,955 | 3,998 | 4,057 | 3,681 | 3,800 |
| 2020 | 3,522 | 4,028 | 4,731 | 4,503 | 4,143 | 3,785 | 4,045 | 4,103 | 3,792 | 3,163 | 3,492 | 3,395 |
| 2021 | 4,102 | 4,155 | 4,318 | 4,613 | 4,782 | 4,726 | 4,668 | 4,571 | 4,336 | 4,046 | 3,942 | 4,051 |
| 2022 | 4,577 | 4,301 | 4,625 | 4,649 | 4,862 | 4,953 | 4,986 | 4,522 | 4,926 | 4,065 | 4,330 | 4,358 |
| 2023 | 4,185 | 4,330 | 4,671 | 4,729 | 5,043 | 4,906 | 4,458 | 4,748 | 4,309 | 4,132 | 3,866 | 3,556 |
| 2024 | 3,701 | |||||||||||
| - = No Data Reported; -- = Not Applicable; NA = Not Available; W = Withheld to avoid disclosure of individual company data. |
| Release Date: 3/29/2024 |
| Next Release Date: 4/30/2024 |