|
Download Data (XLS File) |
|
||||||||
|
||||||||
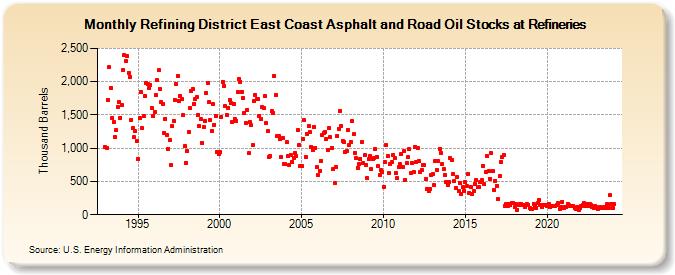
| Refining District East Coast Asphalt and Road Oil Stocks at Refineries (Thousand Barrels) | ||||||||
| Year | Jan | Feb | Mar | Apr | May | Jun | Jul | Aug | Sep | Oct | Nov | Dec |
|---|---|---|---|---|---|---|---|---|---|---|---|---|
| 1993 | 1,015 | 1,008 | 1,731 | 2,218 | 1,910 | 1,460 | 1,396 | 1,163 | 1,266 | 1,624 | 1,691 | 1,461 |
| 1994 | 1,651 | 2,182 | 2,399 | 2,308 | 2,383 | 2,135 | 2,071 | 1,426 | 1,298 | 1,162 | 1,254 | 1,109 |
| 1995 | 840 | 1,451 | 1,845 | 1,302 | 1,477 | 1,782 | 1,986 | 1,958 | 1,903 | 1,946 | 1,605 | 1,487 |
| 1996 | 1,544 | 1,795 | 2,019 | 2,170 | 1,893 | 1,689 | 1,669 | 1,232 | 1,444 | 1,199 | 989 | 1,122 |
| 1997 | 744 | 1,335 | 1,413 | 1,720 | 1,966 | 2,091 | 1,711 | 1,787 | 1,733 | 1,498 | 1,032 | 783 |
| 1998 | 956 | 1,248 | 1,598 | 1,867 | 1,891 | 1,670 | 1,738 | 1,762 | 1,505 | 1,331 | 1,432 | 1,083 |
| 1999 | 1,311 | 1,414 | 1,828 | 1,982 | 1,693 | 1,418 | 1,263 | 1,663 | 1,354 | 1,489 | 945 | 911 |
| 2000 | 941 | 1,471 | 2,002 | 1,938 | 1,629 | 1,502 | 1,607 | 1,719 | 1,672 | 1,400 | 1,667 | 1,442 |
| 2001 | 1,416 | 1,839 | 2,043 | 2,001 | 1,852 | 1,752 | 1,529 | 1,381 | 1,575 | 922 | 1,397 | 1,344 |
| 2002 | 1,045 | 1,708 | 1,796 | 1,742 | 1,737 | 1,487 | 1,439 | 1,617 | 1,609 | 1,779 | 1,374 | 1,254 |
| 2003 | 864 | 879 | 1,557 | 1,533 | 2,089 | 1,797 | 1,186 | 1,180 | 1,133 | 865 | 1,155 | 767 |
| 2004 | 755 | 1,087 | 881 | 749 | 899 | 797 | 849 | 935 | 890 | 1,269 | 1,045 | 738 |
| 2005 | 725 | 1,133 | 1,417 | 866 | 1,218 | 1,332 | 1,250 | 1,021 | 969 | 1,323 | 1,008 | 716 |
| 2006 | 596 | 662 | 813 | 1,197 | 1,229 | 1,238 | 1,142 | 972 | 1,300 | 1,161 | 1,007 | 680 |
| 2007 | 470 | 714 | 1,186 | 1,290 | 1,556 | 1,337 | 1,103 | 1,092 | 939 | 955 | 1,279 | 1,053 |
| 2008 | 1,095 | 1,406 | 1,208 | 935 | 848 | 708 | 758 | 839 | 1,096 | 776 | 893 | 753 |
| 2009 | 547 | 833 | 889 | 686 | 839 | 854 | 985 | 875 | 732 | 596 | 667 | 646 |
| 2010 | 423 | 786 | 1,045 | 884 | 624 | 767 | 785 | 891 | 846 | 629 | 546 | 713 |
| 2011 | 758 | 917 | 720 | 952 | 529 | 774 | 869 | 983 | 620 | 778 | 642 | 1,023 |
| 2012 | 791 | 996 | 800 | 646 | 672 | 753 | 748 | 538 | 380 | 360 | 390 | 595 |
| 2013 | 605 | 442 | 807 | 675 | 810 | 984 | 933 | 766 | 686 | 599 | 496 | 453 |
| 2014 | 495 | 852 | 828 | 615 | 504 | 405 | 574 | 351 | 473 | 317 | 418 | 363 |
| 2015 | 488 | 426 | 606 | 332 | 422 | 310 | 356 | 463 | 520 | 412 | 412 | 492 |
| 2016 | 517 | 729 | 456 | 641 | 881 | 658 | 543 | 921 | 653 | 375 | 512 | 437 |
| 2017 | 233 | 575 | 798 | 869 | 898 | 132 | 158 | 138 | 161 | 144 | 174 | 176 |
| 2018 | 115 | 157 | 75 | 147 | 158 | 166 | 146 | 145 | 118 | 160 | 153 | 96 |
| 2019 | 89 | 91 | 166 | 128 | 108 | 177 | 225 | 145 | 114 | 145 | 140 | 149 |
| 2020 | 125 | 165 | 110 | 133 | 137 | 127 | 126 | 146 | 170 | 79 | 118 | 195 |
| 2021 | 98 | 119 | 117 | 167 | 139 | 131 | 135 | 136 | 98 | 80 | 118 | 78 |
| 2022 | 103 | 126 | 153 | 171 | 129 | 159 | 135 | 160 | 149 | 115 | 100 | 137 |
| 2023 | 117 | 80 | 103 | 119 | 95 | 96 | 117 | 108 | 158 | 107 | 290 | 165 |
| 2024 | 104 | |||||||||||
| - = No Data Reported; -- = Not Applicable; NA = Not Available; W = Withheld to avoid disclosure of individual company data. |
| Release Date: 3/29/2024 |
| Next Release Date: 4/30/2024 |
Referring Pages: