|
Download Data (XLS File) |
|
||||||||
|
||||||||
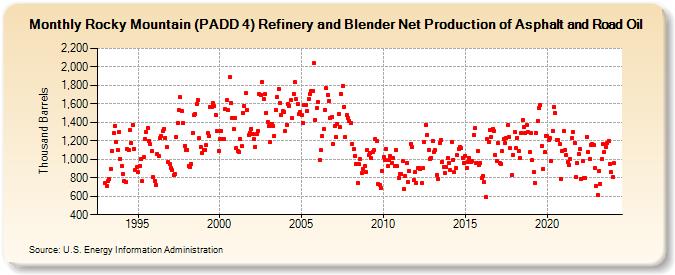
| Rocky Mountain (PADD 4) Refinery and Blender Net Production of Asphalt and Road Oil (Thousand Barrels) | ||||||||
| Year | Jan | Feb | Mar | Apr | May | Jun | Jul | Aug | Sep | Oct | Nov | Dec |
|---|---|---|---|---|---|---|---|---|---|---|---|---|
| 1993 | 743 | 713 | 763 | 783 | 900 | 1,091 | 1,281 | 1,358 | 1,188 | 1,103 | 1,300 | 1,002 |
| 1994 | 931 | 836 | 764 | 759 | 1,107 | 1,097 | 1,313 | 1,181 | 1,372 | 1,114 | 886 | 912 |
| 1995 | 857 | 929 | 1,000 | 766 | 1,022 | 1,220 | 1,295 | 1,339 | 1,202 | 1,162 | 1,085 | 806 |
| 1996 | 768 | 722 | 1,055 | 1,037 | 1,227 | 1,257 | 1,302 | 1,333 | 1,233 | 1,129 | 969 | 951 |
| 1997 | 908 | 881 | 827 | 841 | 1,242 | 1,395 | 1,537 | 1,670 | 1,521 | 1,392 | 1,144 | 1,105 |
| 1998 | 1,102 | 932 | 915 | 947 | 1,285 | 1,474 | 1,490 | 1,597 | 1,641 | 1,226 | 1,129 | 1,073 |
| 1999 | 1,105 | 1,105 | 1,150 | 1,279 | 1,248 | 1,565 | 1,569 | 1,604 | 1,573 | 1,484 | 1,304 | 1,092 |
| 2000 | 1,215 | 1,304 | 1,214 | 1,216 | 1,541 | 1,639 | 1,532 | 1,885 | 1,610 | 1,451 | 1,326 | 1,452 |
| 2001 | 1,121 | 1,092 | 1,079 | 1,220 | 1,139 | 1,505 | 1,579 | 1,712 | 1,538 | 1,261 | 1,288 | 1,332 |
| 2002 | 1,276 | 1,215 | 1,138 | 1,275 | 1,310 | 1,704 | 1,700 | 1,838 | 1,650 | 1,703 | 1,506 | 1,401 |
| 2003 | 1,360 | 1,184 | 1,384 | 1,355 | 1,255 | 1,538 | 1,676 | 1,758 | 1,613 | 1,479 | 1,520 | 1,514 |
| 2004 | 1,303 | 1,375 | 1,593 | 1,581 | 1,641 | 1,445 | 1,710 | 1,832 | 1,651 | 1,596 | 1,488 | 1,509 |
| 2005 | 1,479 | 1,397 | 1,592 | 1,592 | 1,525 | 1,653 | 1,704 | 1,740 | 1,739 | 2,038 | 1,429 | 1,557 |
| 2006 | 1,620 | 990 | 1,097 | 1,256 | 1,329 | 1,538 | 1,766 | 1,700 | 1,635 | 1,447 | 1,457 | 1,167 |
| 2007 | 1,358 | 1,244 | 1,377 | 1,495 | 1,351 | 1,709 | 1,798 | 1,567 | 1,240 | 1,481 | 1,446 | 1,409 |
| 2008 | 1,391 | 1,170 | 1,108 | 1,040 | 949 | 748 | 946 | 999 | 848 | 897 | 931 | 862 |
| 2009 | 1,100 | 1,046 | 1,066 | 1,010 | 1,082 | 1,097 | 1,222 | 1,199 | 731 | 723 | 685 | 878 |
| 2010 | 1,022 | 991 | 1,111 | 929 | 994 | 1,034 | 964 | 1,019 | 928 | 1,102 | 923 | 798 |
| 2011 | 846 | 839 | 977 | 675 | 819 | 959 | 752 | 878 | 1,166 | 1,128 | 772 | 860 |
| 2012 | 748 | 902 | 910 | 894 | 746 | 901 | 1,192 | 1,372 | 1,267 | 1,102 | 1,004 | 1,018 |
| 2013 | 1,200 | 1,076 | 1,095 | 834 | 787 | 1,175 | 1,207 | 968 | 918 | 854 | 916 | 1,012 |
| 2014 | 962 | 883 | 1,185 | 997 | 859 | 901 | 1,041 | 1,113 | 1,138 | 1,117 | 1,019 | 964 |
| 2015 | 1,040 | 902 | 972 | 1,013 | 974 | 982 | 1,265 | 1,337 | 965 | 1,088 | 941 | 957 |
| 2016 | 796 | 823 | 753 | 587 | 1,218 | 1,189 | 1,313 | 1,242 | 1,326 | 1,308 | 1,047 | 978 |
| 2017 | 1,176 | 961 | 947 | 1,086 | 1,216 | 1,176 | 1,230 | 1,368 | 1,245 | 1,117 | 825 | 1,050 |
| 2018 | 1,295 | 1,119 | 1,233 | 1,087 | 1,019 | 1,285 | 1,425 | 1,344 | 1,285 | 1,368 | 1,295 | 1,074 |
| 2019 | 1,287 | 987 | 862 | 746 | 1,289 | 1,417 | 1,553 | 1,588 | 1,148 | 900 | 1,075 | 1,255 |
| 2020 | 1,248 | 1,206 | 1,225 | 984 | 1,306 | 1,564 | 1,498 | 1,209 | 1,211 | 1,160 | 790 | 1,090 |
| 2021 | 1,305 | 1,100 | 1,044 | 967 | 941 | 1,002 | 1,228 | 1,294 | 1,175 | 811 | 956 | 1,059 |
| 2022 | 1,110 | 789 | 978 | 795 | 794 | 1,244 | 1,083 | 1,004 | 1,158 | 1,166 | 1,159 | 903 |
| 2023 | 709 | 612 | 868 | 737 | 998 | 1,160 | 1,080 | 1,136 | 1,174 | 1,201 | 954 | 858 |
| 2024 | 803 | |||||||||||
| - = No Data Reported; -- = Not Applicable; NA = Not Available; W = Withheld to avoid disclosure of individual company data. |
| Release Date: 3/29/2024 |
| Next Release Date: 4/30/2024 |