|
Download Data (XLS File) |
|
||||||||
|
||||||||
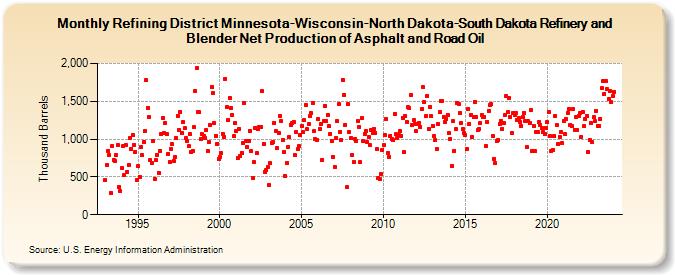
| Refining District Minnesota-Wisconsin-North Dakota-South Dakota Refinery and Blender Net Production of Asphalt and Road Oil (Thousand Barrels) | ||||||||
| Year | Jan | Feb | Mar | Apr | May | Jun | Jul | Aug | Sep | Oct | Nov | Dec |
|---|---|---|---|---|---|---|---|---|---|---|---|---|
| 1993 | 458 | 660 | 848 | 786 | 288 | 912 | 728 | 713 | 788 | 923 | 367 | 309 |
| 1994 | 618 | 914 | 520 | 925 | 571 | 654 | 1,012 | 873 | 1,052 | 928 | 834 | 465 |
| 1995 | 643 | 504 | 902 | 786 | 962 | 1,110 | 1,777 | 1,412 | 1,292 | 722 | 687 | 978 |
| 1996 | 477 | 724 | 794 | 555 | 843 | 1,073 | 1,278 | 1,077 | 1,215 | 1,064 | 805 | 701 |
| 1997 | 871 | 931 | 715 | 765 | 1,014 | 1,311 | 1,124 | 1,362 | 1,084 | 1,222 | 1,141 | 1,011 |
| 1998 | 973 | 903 | 1,064 | 825 | 841 | 1,156 | 1,640 | 1,934 | 1,358 | 1,353 | 1,000 | 1,063 |
| 1999 | 1,040 | 1,010 | 1,117 | 840 | 962 | 1,189 | 1,690 | 1,612 | 1,209 | 1,046 | 940 | 737 |
| 2000 | 763 | 810 | 1,069 | 1,032 | 1,799 | 1,419 | 1,254 | 1,550 | 1,408 | 1,316 | 1,035 | 1,216 |
| 2001 | 1,112 | 750 | 1,140 | 776 | 821 | 954 | 1,483 | 976 | 900 | 976 | 1,112 | 841 |
| 2002 | 490 | 694 | 1,151 | 812 | 1,128 | 1,156 | 1,159 | 1,634 | 939 | 567 | 588 | 631 |
| 2003 | 392 | 680 | 952 | 960 | 1,213 | 1,109 | 884 | 1,085 | 1,307 | 1,239 | 984 | 834 |
| 2004 | 514 | 685 | 899 | 1,030 | 1,193 | 1,211 | 1,228 | 786 | 1,092 | 866 | 903 | 1,055 |
| 2005 | 1,179 | 1,093 | 1,248 | 1,454 | 1,128 | 1,198 | 1,309 | 1,339 | 1,480 | 1,101 | 999 | 994 |
| 2006 | 1,263 | 1,132 | 1,194 | 727 | 1,238 | 1,444 | 1,238 | 1,320 | 1,169 | 1,071 | 973 | 768 |
| 2007 | 635 | 1,013 | 1,237 | 1,459 | 1,091 | 987 | 1,788 | 1,587 | 1,193 | 362 | 1,465 | 1,093 |
| 2008 | 1,014 | 787 | 694 | 1,004 | 979 | 1,237 | 1,161 | 693 | 1,280 | 978 | 1,071 | 1,109 |
| 2009 | 956 | 1,030 | 917 | 1,118 | 1,077 | 1,137 | 1,081 | 869 | 492 | 470 | 540 | 860 |
| 2010 | 917 | 1,051 | 1,266 | 816 | 769 | 1,045 | 1,007 | 982 | 1,337 | 1,063 | 1,013 | 1,052 |
| 2011 | 1,104 | 1,043 | 1,285 | 827 | 1,308 | 1,228 | 1,419 | 1,406 | 1,586 | 1,188 | 1,246 | 1,203 |
| 2012 | 1,103 | 1,200 | 1,215 | 1,161 | 1,395 | 1,685 | 1,490 | 1,302 | 1,575 | 1,136 | 1,430 | 1,300 |
| 2013 | 1,179 | 1,041 | 986 | 871 | 1,196 | 1,355 | 1,510 | 1,502 | 1,294 | 1,232 | 1,268 | 1,323 |
| 2014 | 1,081 | 1,006 | 647 | 1,236 | 847 | 1,130 | 1,473 | 1,464 | 1,339 | 1,211 | 1,128 | 1,080 |
| 2015 | 1,057 | 865 | 1,403 | 1,200 | 1,324 | 1,032 | 1,286 | 1,497 | 1,288 | 1,119 | 1,136 | 1,216 |
| 2016 | 1,325 | 1,286 | 1,298 | 911 | 1,232 | 1,378 | 1,457 | 1,462 | 1,047 | 742 | 680 | 971 |
| 2017 | 991 | 1,198 | 1,245 | 1,138 | 1,208 | 1,323 | 1,568 | 1,352 | 1,549 | 1,295 | 1,084 | 1,342 |
| 2018 | 1,323 | 1,343 | 1,257 | 1,277 | 1,229 | 1,175 | 1,288 | 1,351 | 1,233 | 889 | 1,235 | 1,210 |
| 2019 | 1,379 | 848 | 1,173 | 839 | 1,099 | 1,095 | 1,227 | 1,189 | 1,153 | 1,092 | 1,061 | 1,153 |
| 2020 | 1,222 | 1,357 | 1,041 | 848 | 859 | 1,036 | 1,307 | 1,182 | 939 | 1,029 | 1,094 | 948 |
| 2021 | 1,241 | 1,065 | 1,260 | 1,351 | 1,396 | 1,188 | 1,168 | 1,397 | 1,126 | 1,290 | 1,121 | 1,310 |
| 2022 | 1,342 | 1,031 | 1,364 | 1,175 | 1,272 | 1,312 | 832 | 988 | 1,216 | 960 | 1,287 | 1,238 |
| 2023 | 1,376 | 1,176 | 1,179 | 1,272 | 1,674 | 1,773 | 1,600 | 1,767 | 1,661 | 1,524 | 1,639 | 1,485 |
| 2024 | 1,571 | |||||||||||
| - = No Data Reported; -- = Not Applicable; NA = Not Available; W = Withheld to avoid disclosure of individual company data. |
| Release Date: 3/29/2024 |
| Next Release Date: 4/30/2024 |