|
Download Data (XLS File) |
|
||||||||
|
||||||||
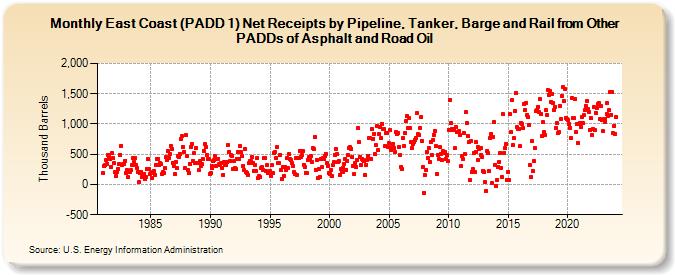
| East Coast (PADD 1) Net Receipts by Pipeline, Tanker, and Barge from Other PADDs of Asphalt and Road Oil (Thousand Barrels) | ||||||||
| Year | Jan | Feb | Mar | Apr | May | Jun | Jul | Aug | Sep | Oct | Nov | Dec |
|---|---|---|---|---|---|---|---|---|---|---|---|---|
| 1981 | 190 | 303 | 330 | 404 | 344 | 493 | 460 | 419 | 292 | 517 | 441 | 351 |
| 1982 | 210 | 143 | 200 | 261 | 336 | 488 | 644 | 318 | 335 | 343 | 390 | 192 |
| 1983 | 239 | 116 | 202 | 198 | 235 | 315 | 444 | 371 | 445 | 319 | 264 | 212 |
| 1984 | 37 | 188 | 212 | 130 | 166 | 179 | 86 | 127 | 263 | 416 | 252 | 174 |
| 1985 | 188 | 103 | 204 | 216 | 158 | 330 | 426 | 424 | 330 | 363 | 331 | 173 |
| 1986 | 210 | 187 | 274 | 447 | 405 | 551 | 440 | 499 | 643 | 585 | 361 | 303 |
| 1987 | 173 | 377 | 267 | 477 | 454 | 508 | 752 | 795 | 623 | 535 | 267 | 816 |
| 1988 | 474 | 237 | 186 | 339 | 621 | 669 | 385 | 515 | 349 | 604 | 358 | 363 |
| 1989 | 235 | 383 | 310 | 339 | 425 | 554 | 663 | 620 | 491 | 415 | 425 | 172 |
| 1990 | 184 | 311 | 264 | 382 | 404 | 468 | 313 | 417 | 425 | 332 | 329 | 360 |
| 1991 | 278 | 157 | 379 | 327 | 324 | 368 | 653 | 543 | 380 | 481 | 474 | 250 |
| 1992 | 387 | 268 | 255 | 427 | 536 | 423 | 633 | 533 | 466 | 308 | 236 | 591 |
| 1993 | 213 | 192 | 149 | 348 | 385 | 383 | 447 | 363 | 230 | 324 | 226 | 438 |
| 1994 | 110 | 148 | 119 | 267 | 281 | 245 | 434 | 432 | 220 | 316 | 196 | 207 |
| 1995 | 215 | 139 | 316 | 188 | 514 | 533 | 444 | 617 | 357 | 348 | 491 | 237 |
| 1996 | 83 | 294 | 148 | 292 | 231 | 439 | 273 | 499 | 413 | 400 | 350 | 299 |
| 1997 | 201 | 171 | 437 | 151 | 433 | 438 | 556 | 453 | 491 | 561 | 328 | 289 |
| 1998 | 194 | 195 | 405 | 448 | 420 | 472 | 364 | 596 | 586 | 787 | 247 | 409 |
| 1999 | 105 | 248 | 129 | 424 | 281 | 435 | 415 | 463 | 509 | 352 | 312 | 190 |
| 2000 | 179 | 247 | 143 | 320 | 371 | 488 | 589 | 497 | 371 | 386 | 152 | 258 |
| 2001 | 207 | 209 | 277 | 345 | 426 | 244 | 392 | 484 | 604 | 612 | 594 | 461 |
| 2002 | 309 | 176 | 360 | 281 | 409 | 932 | 699 | 457 | 324 | 423 | 403 | 381 |
| 2003 | 159 | 328 | 407 | 476 | 766 | 760 | 429 | 913 | 758 | 841 | 497 | 645 |
| 2004 | 966 | 572 | 836 | 947 | 768 | 1,006 | 909 | 914 | 642 | 850 | 845 | 616 |
| 2005 | 680 | 896 | 575 | 621 | 675 | 611 | 539 | 867 | 835 | 852 | 620 | 483 |
| 2006 | 295 | 254 | 761 | 640 | 852 | 1,050 | 1,134 | 927 | 1,092 | 930 | 694 | 599 |
| 2007 | 668 | 710 | 743 | 774 | 1,178 | 832 | 822 | 928 | 1,113 | 713 | 292 | -133 |
| 2008 | 156 | 244 | 541 | 439 | 604 | 378 | 710 | 491 | 728 | 822 | 884 | 631 |
| 2009 | 171 | 489 | 413 | 617 | 510 | 404 | 546 | 528 | 533 | 422 | 488 | 382 |
| 2010 | 908 | 1,396 | 1,013 | 921 | 899 | 924 | 598 | 947 | 862 | 871 | 881 | 811 |
| 2011 | 298 | 478 | 422 | 859 | 503 | 1,193 | 1,016 | 806 | 694 | 73 | 721 | 212 |
| 2012 | 251 | 521 | 201 | 542 | 700 | 620 | 410 | 584 | 610 | 493 | 450 | 228 |
| 2013 | 208 | 34 | -105 | 556 | 515 | 218 | 771 | 836 | 21 | 787 | 1,030 | 326 |
| 2014 | -32 | 76 | 294 | 372 | 524 | 279 | 126 | 1,160 | 522 | 599 | 675 | 77 |
| 2015 | 208 | 70 | 1,159 | 860 | 1,390 | 649 | 766 | 1,215 | 1,513 | 944 | 925 | 922 |
| 2016 | 632 | 1,022 | 996 | 930 | 1,328 | 1,238 | 1,354 | 1,155 | 1,115 | 988 | 330 | 127 |
| 2017 | 714 | 219 | 387 | 596 | 1,221 | 1,227 | 1,286 | 1,196 | 1,409 | 1,165 | 798 | 1,025 |
| 2018 | 875 | 810 | 1,223 | 1,151 | 1,555 | 1,473 | 1,541 | 1,371 | 1,501 | 1,349 | 1,233 | 1,288 |
| 2019 | 931 | 1,017 | 844 | 875 | 1,293 | 1,077 | 1,461 | 1,610 | 1,376 | 1,580 | 1,101 | 1,088 |
| 2020 | 1,071 | 1,000 | 938 | 766 | 1,437 | 1,105 | 1,099 | 1,416 | 866 | 995 | 692 | 992 |
| 2021 | 1,024 | 958 | 1,123 | 1,016 | 1,144 | 1,224 | 1,305 | 1,382 | 1,245 | 1,194 | 904 | 1,097 |
| 2022 | 817 | 921 | 1,281 | 898 | 1,183 | 1,261 | 1,335 | 1,352 | 1,078 | 1,295 | 1,065 | 882 |
| 2023 | 1,080 | 1,039 | 1,085 | 1,166 | 1,343 | 1,132 | 1,229 | 1,532 | 1,155 | 1,532 | 844 | 973 |
| 2024 | 832 | |||||||||||
| - = No Data Reported; -- = Not Applicable; NA = Not Available; W = Withheld to avoid disclosure of individual company data. |
| Release Date: 3/29/2024 |
| Next Release Date: 4/30/2024 |