|
Download Data (XLS File) |
|
||||||||
|
||||||||
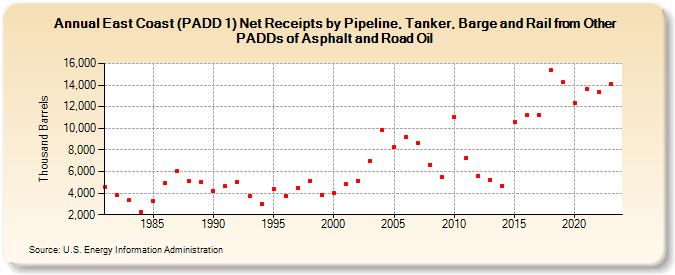
| East Coast (PADD 1) Net Receipts by Pipeline, Tanker, Barge and Rail from Other PADDs of Asphalt and Road Oil (Thousand Barrels) | ||||||||
| Decade | Year-0 | Year-1 | Year-2 | Year-3 | Year-4 | Year-5 | Year-6 | Year-7 | Year-8 | Year-9 |
|---|---|---|---|---|---|---|---|---|---|---|
| 1980's | 4,544 | 3,860 | 3,360 | 2,230 | 3,246 | 4,905 | 6,044 | 5,100 | 5,032 | |
| 1990's | 4,189 | 4,614 | 5,063 | 3,698 | 2,975 | 4,399 | 3,721 | 4,509 | 5,123 | 3,863 |
| 2000's | 4,001 | 4,855 | 5,154 | 6,979 | 9,871 | 8,254 | 9,228 | 8,640 | 6,628 | 5,503 |
| 2010's | 11,030 | 7,275 | 5,610 | 5,196 | 4,671 | 10,622 | 11,215 | 11,242 | 15,370 | 14,252 |
| 2020's | 12,378 | 13,614 | 13,370 | 14,152 |
| - = No Data Reported; -- = Not Applicable; NA = Not Available; W = Withheld to avoid disclosure of individual company data. |
| Release Date: 8/30/2024 |
| Next Release Date: 8/29/2025 |